uniapp使用echarts引入中国地图世界地图(app端,H5)
如何在uniapp中引入地图
·
1.引入echarts
1.在echarts官网引入echarts.min.js文件,我是用的是echart的在线定制。(注意勾选地图。)
https://echarts.apache.org/zh/builder.html
2.找到china.json(中国地图)和world.json(世界地图)
中国地图和世界地图:
链接:https://pan.baidu.com/s/16JwQ8q2W39EtKGq-QCO_4g
提取码:uhmp
china.json部分截图: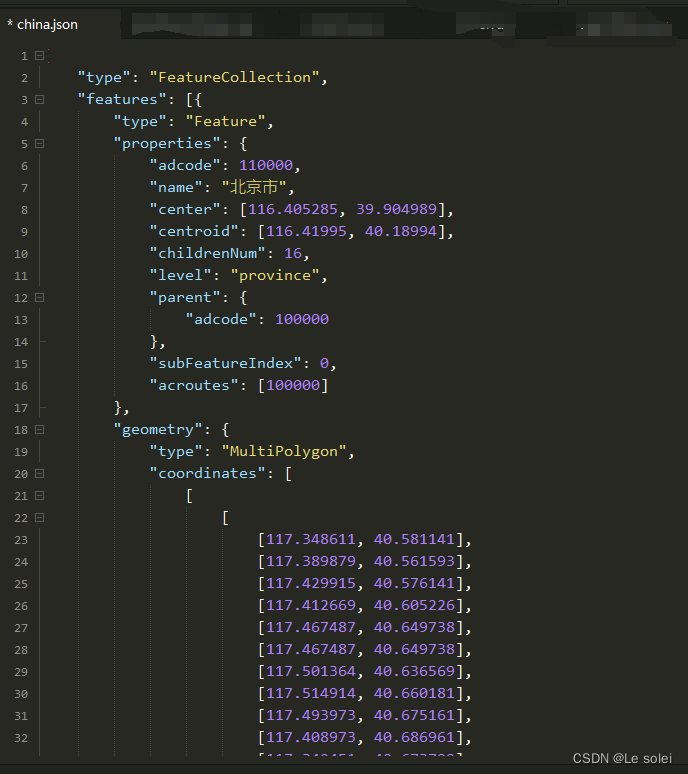
3.在component文件夹下新建echarts文件夹,引入刚下载好的echarts.min.js,并且新建echarts.vue
我的echarts文件夹:
链接:https://pan.baidu.com/s/1IBF1j4nZURGaIb4NfVe8Fg
提取码:7xff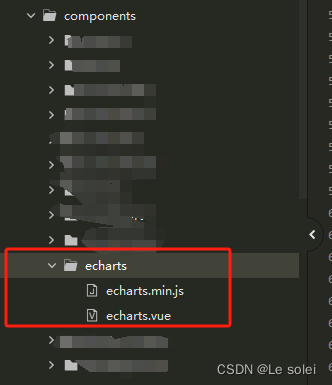
代码如下:
<template>
    <view>
        <view class="echarts" :id="option.id" :style="estyle" :prop="option" :change:prop="echarts.update"
            @click="echarts.onClick"></view>
    </view>
</template>
<script>
    export default {
        name: 'Echarts',
        props: {
            option: {
                type: Object,
                required: true
            },
            estyle: {
                type: String,
                required: false,
                default: ""
            }
        },
        created() {
            // 设置随机数id
            let t = 'ABCDEFGHIJKLMNOPQRSTUVWXYZabcdefghijklmnopqrstuvwxyz0123456789'
            let len = t.length
            let id = ''
            for (let i = 0; i < 32; i++) {
                id += t.charAt(Math.floor(Math.random() * len))
            }
            this.option.id = id
        },
        methods: {
            /** * renderjs内的点击事件,回调到父组件 * @param {Object} params */
            onViewClick(params) {
                this.$emit('click', params)
            }
        }
    }
</script>
<script module="echarts" lang="renderjs">
    import echarts from '@/components/echarts/echarts.min.js'
    export default {
        data() {
            return {
                chart: null,
                clickData: null, // echarts点击事件的值
                optionData: null,
            }
        },
        mounted() {
            this.init();
        },
        methods: {
            /** * 初始化echarts */
            init() {
                // 根据id初始化图表
                this.chart = echarts.init(document.getElementById(this.option.id));
                let jsonData = require('../../unit/china.json')
                echarts.registerMap('china', jsonData)
                let worldData = require('../../unit/world.json')
                echarts.registerMap('world', worldData)
                this.update(this.option);
                console.log(this.chart, 'this.chart');
                // echarts的点击事件
                this.chart.on('click', params => {
                    // 把点击事件的数据缓存下来
                    this.clickData = params;
                })
            },
            /** * 点击事件,可传递到外部 * @param {Object} event * @param {Object} instance */
            onClick(event, instance) {
                console.log(event, instance, this.clickData, 'event, instance');
                // console.log(event, instance,'event, instance');
                if (this.clickData) {
                    // 把echarts点击事件相关的值传递到renderjs外

                    instance.callMethod('onViewClick', {
                        value: this.clickData.data,
                        name: this.clickData.name,
                        seriesName: this.clickData.seriesName
                    })
                    // 上次点击数据置空
                    this.clickData = null
                }
            },
            /** * 监测数据更新 * @param {Object} option */
            update(option) {
                if (this.chart) {
                    // 因App端,回调函数无法从renderjs外传递,故在此自定义设置相关回调函数
                    if (option) {
                        // tooltip
                        if (option.tooltip) {
                            // 判断是否设置tooltip的位置
                            if (option.tooltip.positionStatus) {
                                option.tooltip.position = this.tooltipPosition()
                            }
                            // 判断是否格式化tooltip
                            if (option.tooltip.formatterStatus) {
                                option.tooltip.formatter = this.tooltipFormatter(option.tooltip.formatterUnit, option
                                    .tooltip.formatFloat2, option.tooltip.formatThousands)
                            }
                        }
                    }
                    // 设置新的option
                    this.chart.setOption(option, option.notMerge)
                }
            },
            /** * 设置tooltip的位置,防止超出画布 */
            tooltipPosition() {
                return (point, params, dom, rect, size) => {
                    // 其中point为当前鼠标的位置,size中有两个属性:viewSize和contentSize,分别为外层div和tooltip提示框的大小
                    let x = point[0]
                    let y = point[1]
                    let viewWidth = size.viewSize[0]
                    let viewHeight = size.viewSize[1]
                    let boxWidth = size.contentSize[0]
                    let boxHeight = size.contentSize[1]
                    let posX = 0 // x坐标位置
                    let posY = 0 // y坐标位置
                    if (x >= boxWidth) { // 左边放的下
                        posX = x - boxWidth - 1
                    }
                    if (y >= boxHeight) { // 上边放的下
                        posY = y - boxHeight - 1
                    }
                    return [posX, posY]
                }
            },
            /** * tooltip格式化 * @param {Object} unit 数值后的单位 * @param {Object} formatFloat2 是否保留两位小数 * @param {Object} formatThousands 是否添加千分位 */
            tooltipFormatter(unit, formatFloat2, formatThousands) {
                return params => {
                    let result = ''
                    unit = unit ? unit : ''
                    for (let i in params) {
                        if (i == 0) {
                            result += params[i].axisValueLabel
                        }
                        let value = '--'
                        if (params[i].data !== null) {
                            value = params[i].data
                            // 保留两位小数
                            if (formatFloat2) {
                                value = this.formatFloat2(value)
                            }
                            // 添加千分位
                            if (formatThousands) {
                                value = this.formatThousands(value)
                            }
                        }
                        // #ifdef H5
                        result += '\n' + params[i].seriesName + ':' + value + ' ' + unit
                        // #endif
                        // #ifdef APP-PLUS
                        result += '<br/>' + params[i].marker + params[i].seriesName + ':' + value + ' ' + unit
                        // #endif
                    }
                    return result
                }
            },
            /** * 保留两位小数 * @param {Object} value */
            formatFloat2(value) {
                let temp = Math.round(parseFloat(value) * 100) / 100
                let xsd = temp.toString().split('.')
                if (xsd.length === 1) {
                    temp = (isNaN(temp) ? '0' : temp.toString()) + '.00'
                    return temp
                }
                if (xsd.length > 1) {
                    if (xsd[1].length < 2) {
                        temp = temp.toString() + '0'
                    }
                    return temp
                }
            },
            /** * 添加千分位 * @param {Object} value */
            formatThousands(value) {
                if (value === undefined || value === null) {
                    value = ''
                }
                if (!isNaN(value)) {
                    value = value + ''
                }
                let re = /\d{1,3}(?=(\d{3})+$)/g
                let n1 = value.replace(/^(\d+)((\.\d+)?)$/, function(s, s1, s2) {
                    return s1.replace(re, '$&,') + s2
                })
                return n1
            }
        }
    }
</script>
<style lang="scss" scoped>
    .echarts {
        width: 100%;
        height: 100%;
    }
</style>
这部分代码的重点是init()方法做了改变
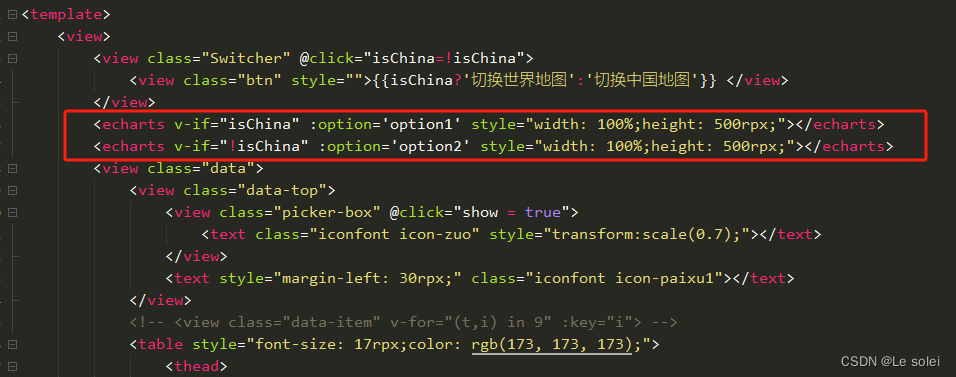
4.在需要的地方引入echarts
option1:
option1: {
					tooltip: {
						trigger: 'item',
						showDelay: 0,
						transitionDuration: 0.2
					},
					toolbox: {
						show: true,
						left: 'left',
						top: 'top',
						feature: {
							dataView: {
								readOnly: false
							},
							restore: {},
							saveAsImage: {}
						}
					},
					visualMap: {
						min: 0,
						max: 500,
						inRange: {
							color: [
								'#313695',
								'#4575b4',
								'#74add1',
								'#abd9e9',
								'#e0f3f8',
								'#ffffbf',
								'#fee090',
								'#fdae61',
								'#f46d43',
								'#d73027',
								'#a50026'
							],
							symbolSize: 10
						},
						text: ['High', 'Low'],
						calculable: true,
					},
					series: [{
						name: '',
						type: 'map',
						roam: true,
						map: 'china',
						emphasis: {
							label: {
								show: true
							}
						},
						data: [{
								name: '北京市',
								value: 123
							},
							{
								name: '陕西省',
								value: 300
							}, {
								name: '台湾省',
								value: 400
							},
						]
					}]
				},
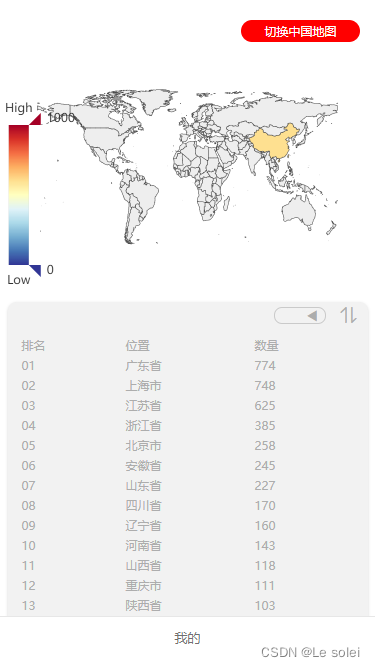
成果如图: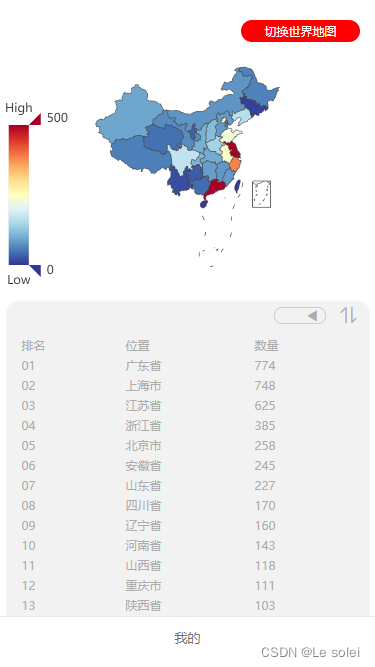

有“AI”的1024 = 2048,欢迎大家加入2048 AI社区
更多推荐


 34
34 0
0- 0


 已为社区贡献1条内容

所有评论(0)