MATLAB | 全网唯一 MATLAB双向弦图(有向弦图)绘制
~
先赞后看,养成习惯~~
先赞后看,养成习惯~~
先赞后看,养成习惯~~
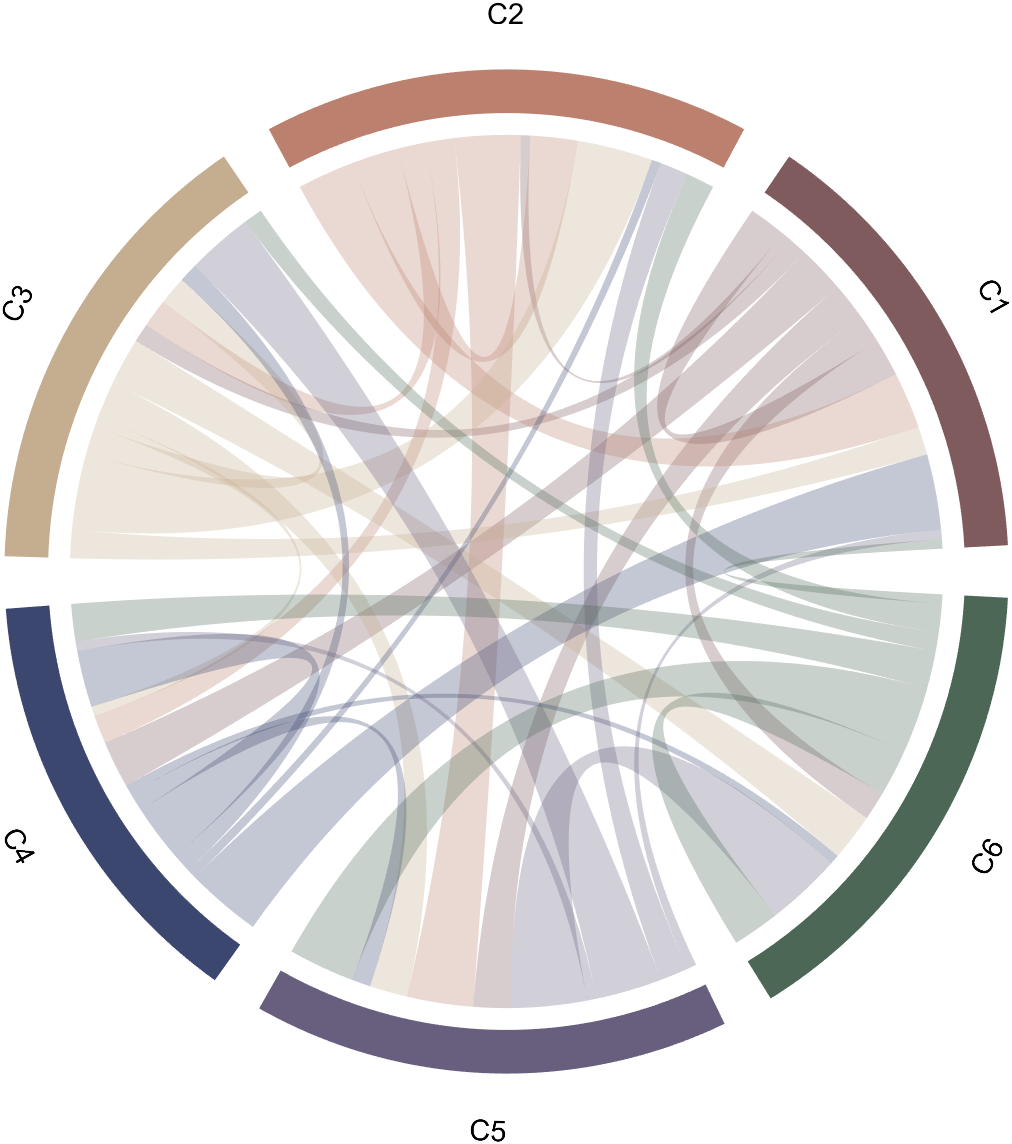
绘制效果
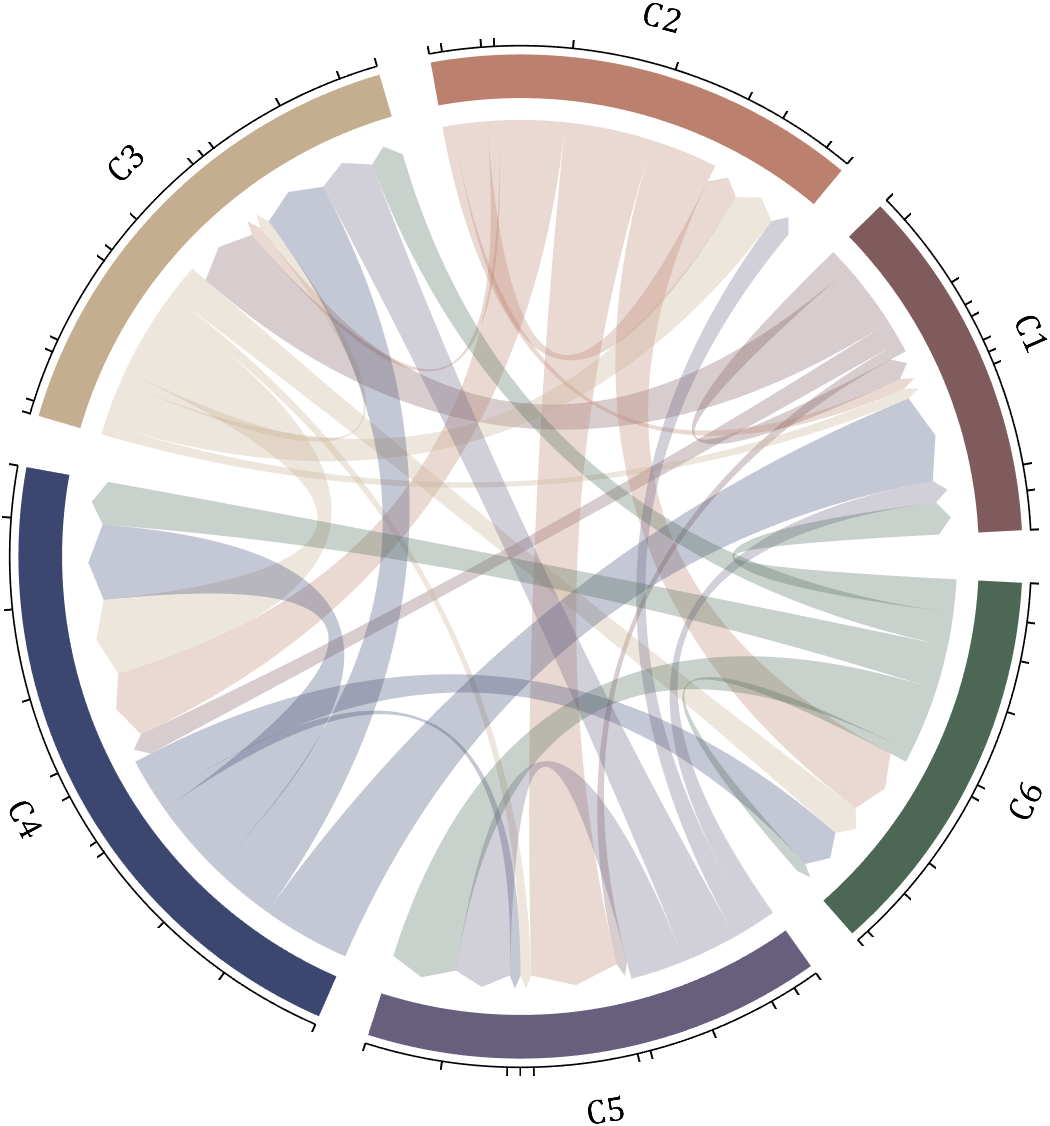

下面这款弦图我已经出了很久了,也陆陆续续增添了新的功能和修了一些bug:
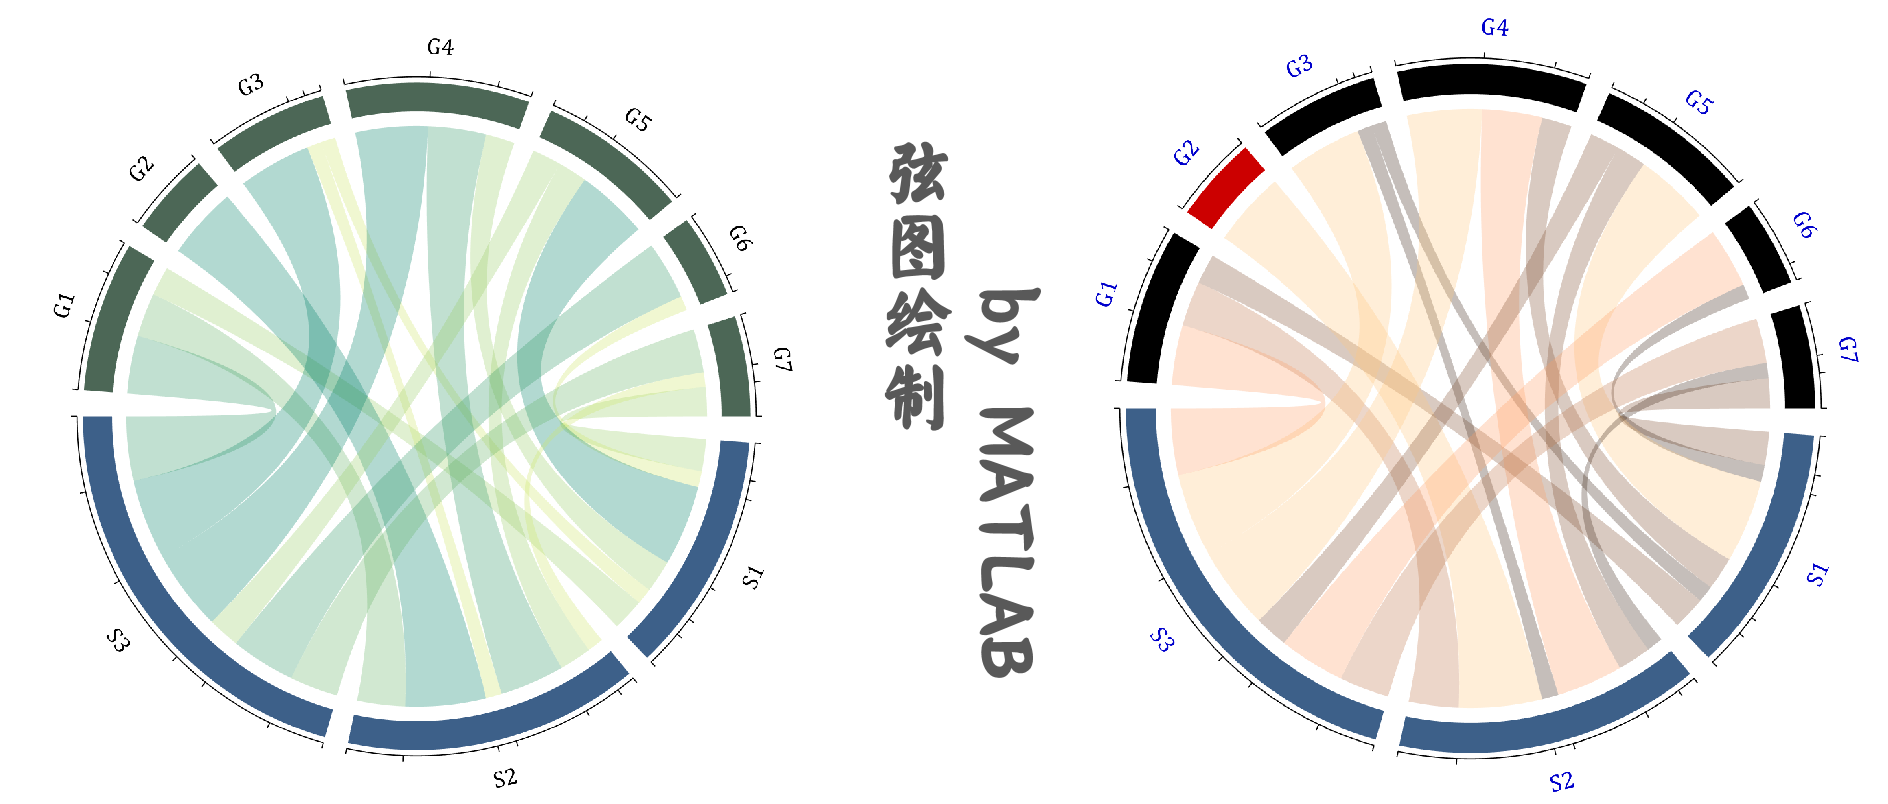
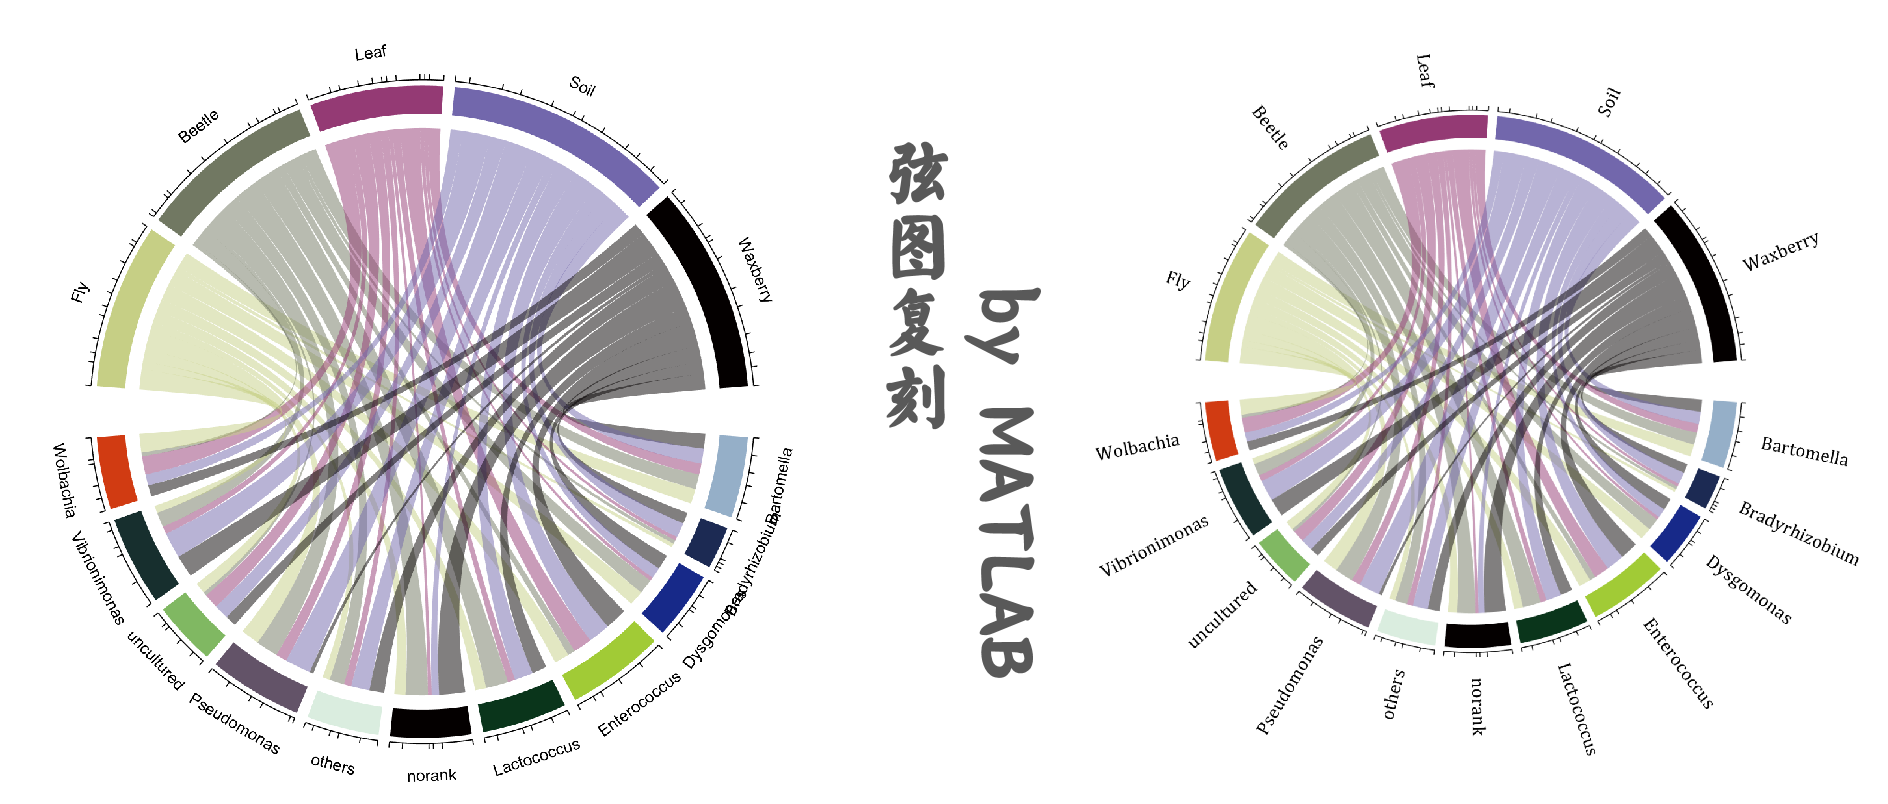
甚至还用它做出了一些复刻,分成两组的弦图有了后就有很多人在催双向的弦图,今天附带超详细解说slandarer自行研发的双向弦图工具函数终于来啦~
详细教程
0 数据准备
数据应准备全是非负数值的方形矩阵,矩阵第i行第j列表示由类i流向类j,第j行第i列表示由类j流向类i,也就是说矩阵是非对称的,可以同时统计两个类互相的数据流动,这里构造个随机数矩阵:
dataMat=randi([0,8],[6,6]);
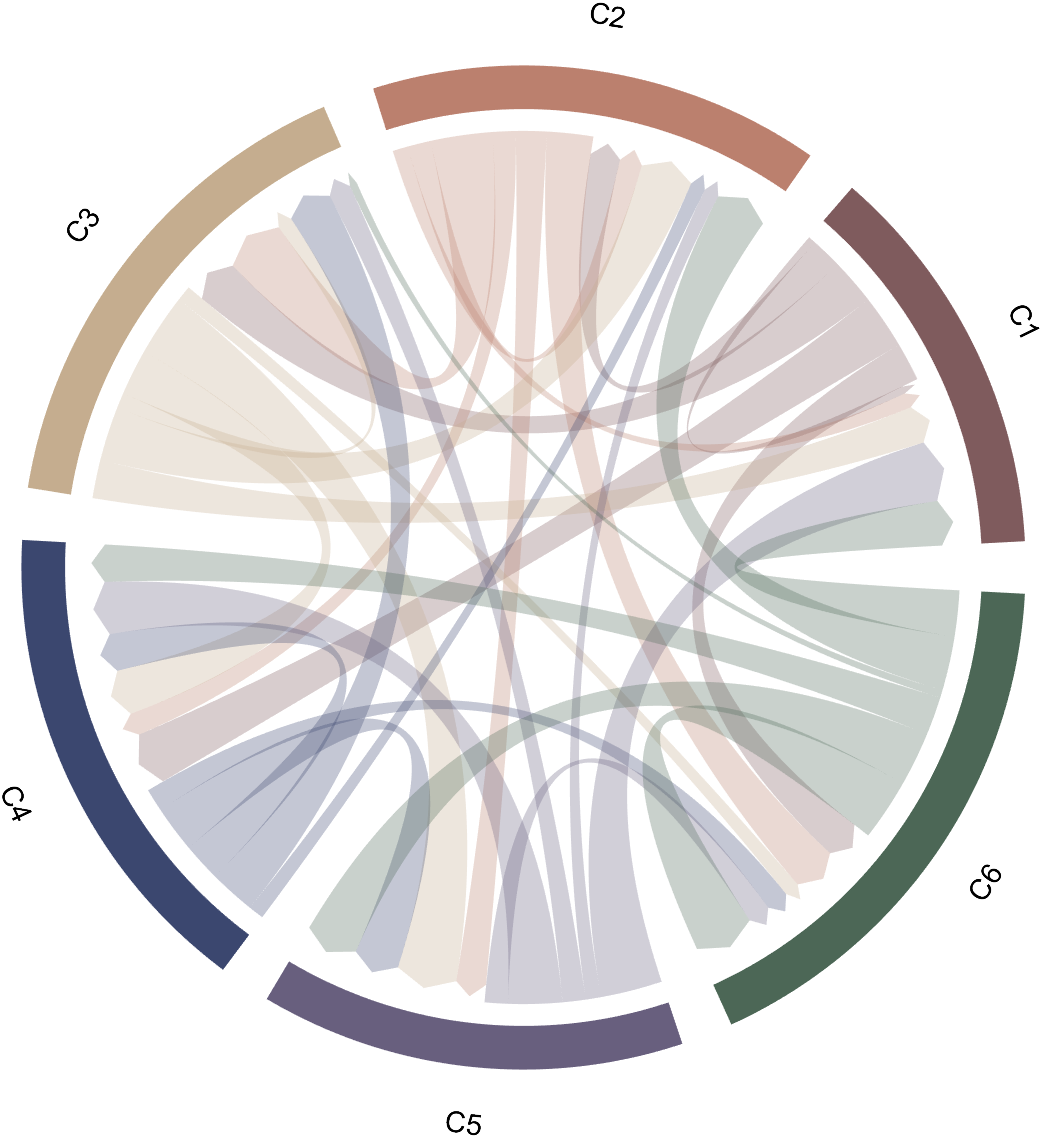
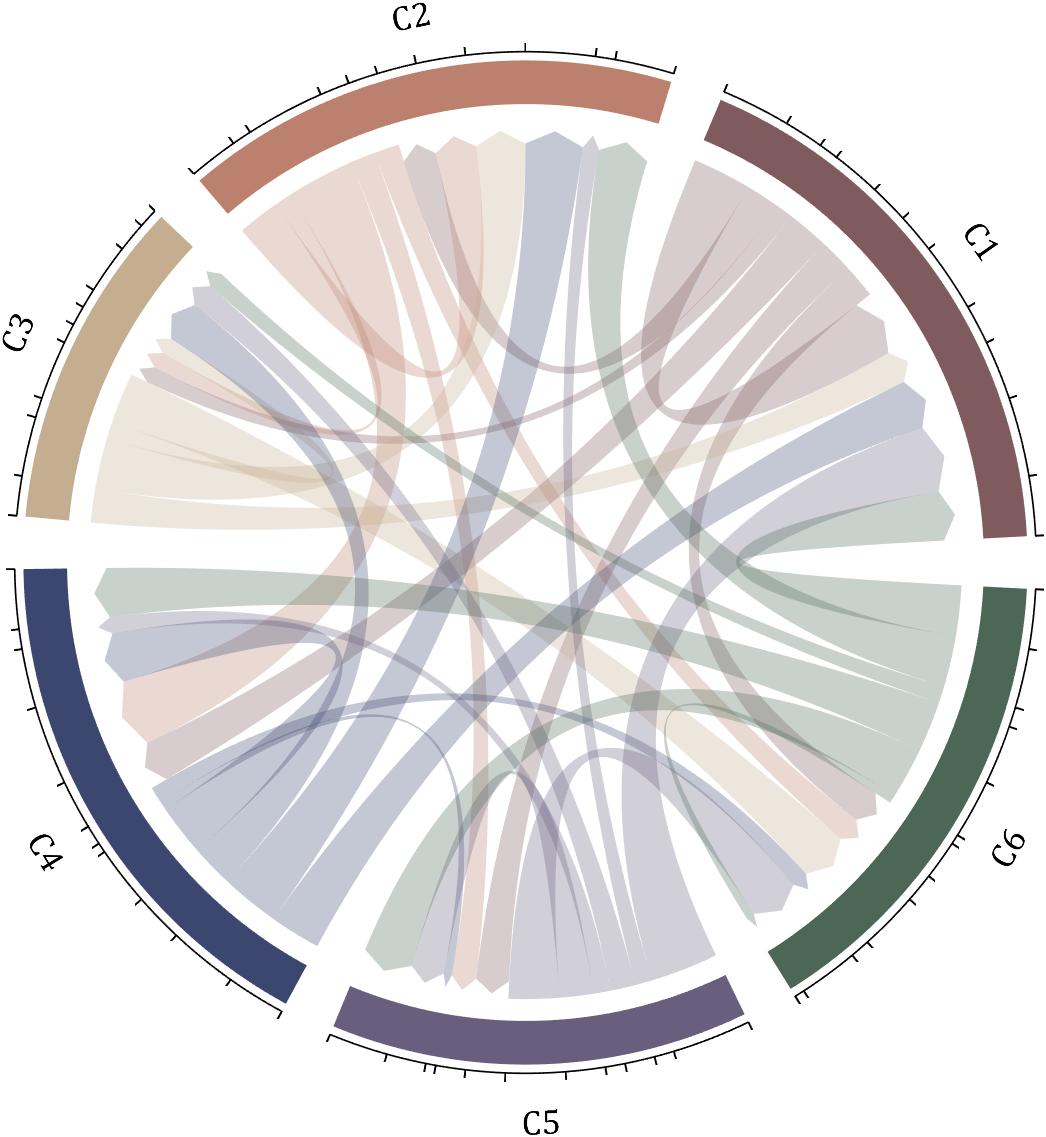
1 基础绘图
两行代码搞定~
dataMat=randi([0,8],[6,6]);

BCC=biChordChart(dataMat);
BCC=BCC.draw();
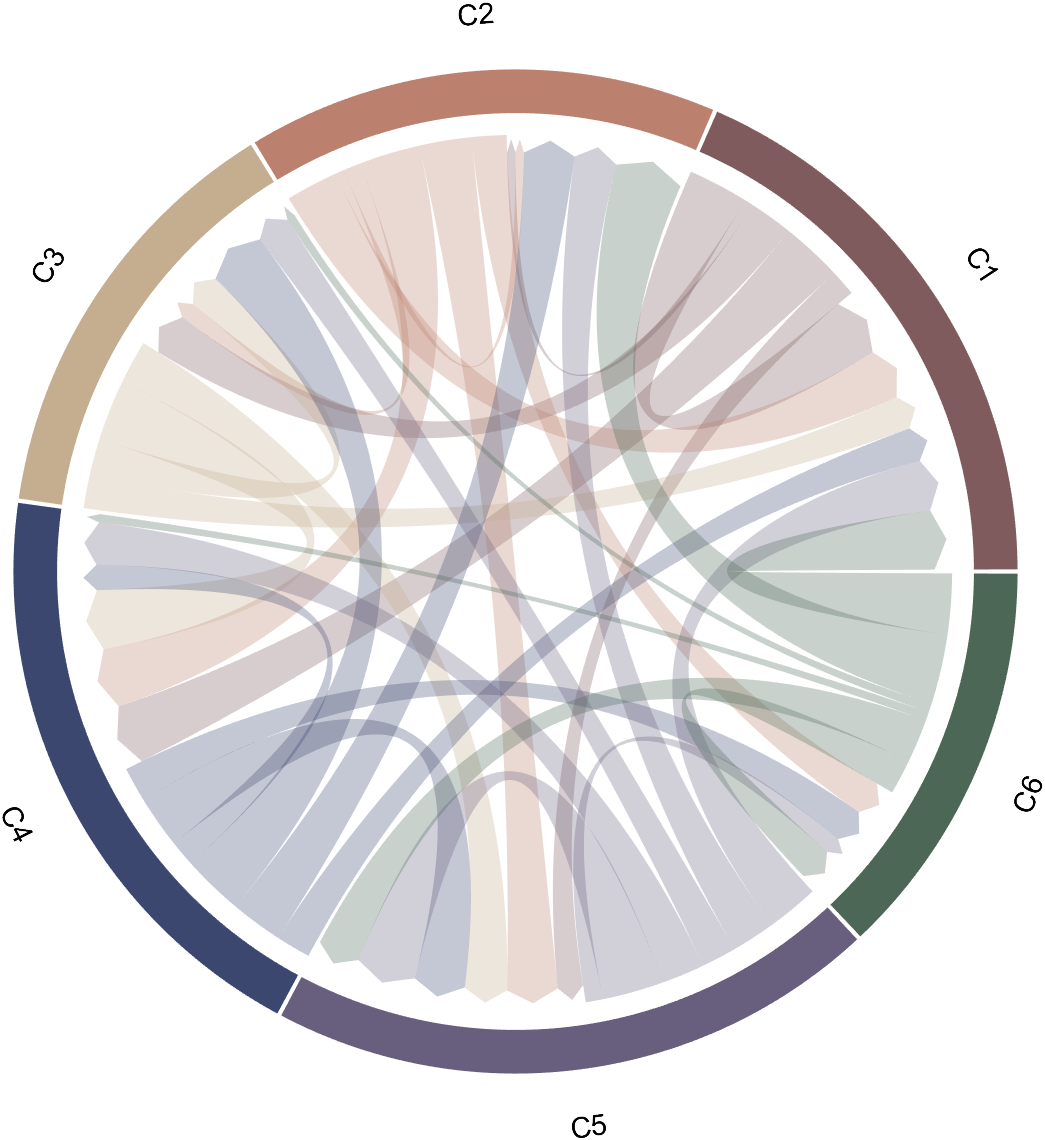
2 方向箭头
两侧都是弧形仅仅靠颜色不容易区分流入还是流出,因此可在创建对象时将Arrow属性设置为'on':
dataMat=randi([0,8],[6,6]);

BCC=biChordChart(dataMat,'Arrow','on');
BCC=BCC.draw();
3 绘图间隙
通过Sep属性可调整绘图间隙,例如设置为特别小的1/120:
dataMat=randi([0,8],[6,6]);

BCC=biChordChart(dataMat,'Arrow','on','Sep',1/120);
BCC=BCC.draw();
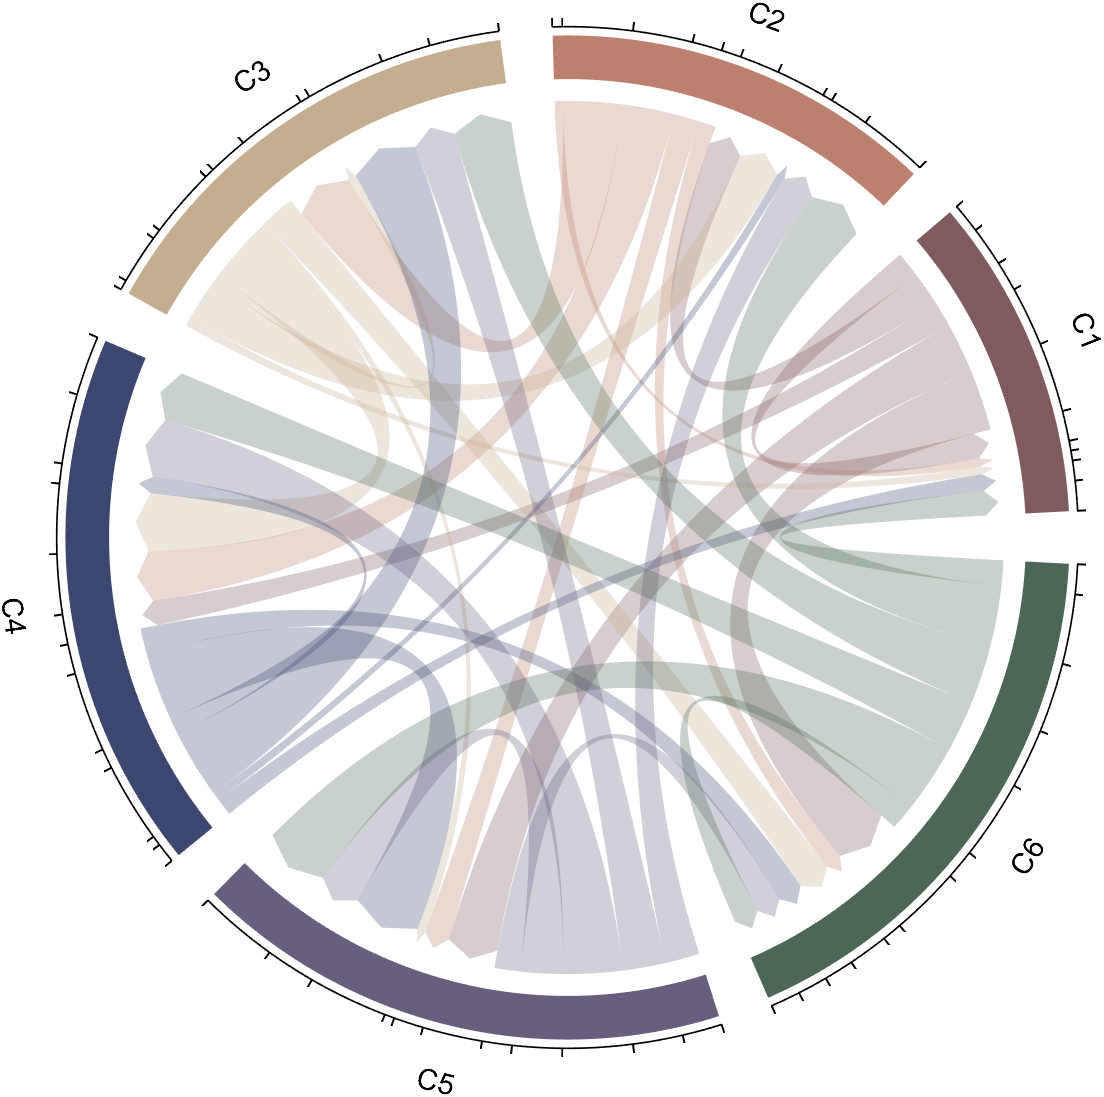
4 添加刻度
通过tickState函数设置显示或者隐藏刻度:
dataMat=randi([0,8],[6,6]);

BCC=biChordChart(dataMat,'Arrow','on');
BCC=BCC.draw();

% 添加刻度
BCC.tickState('on')
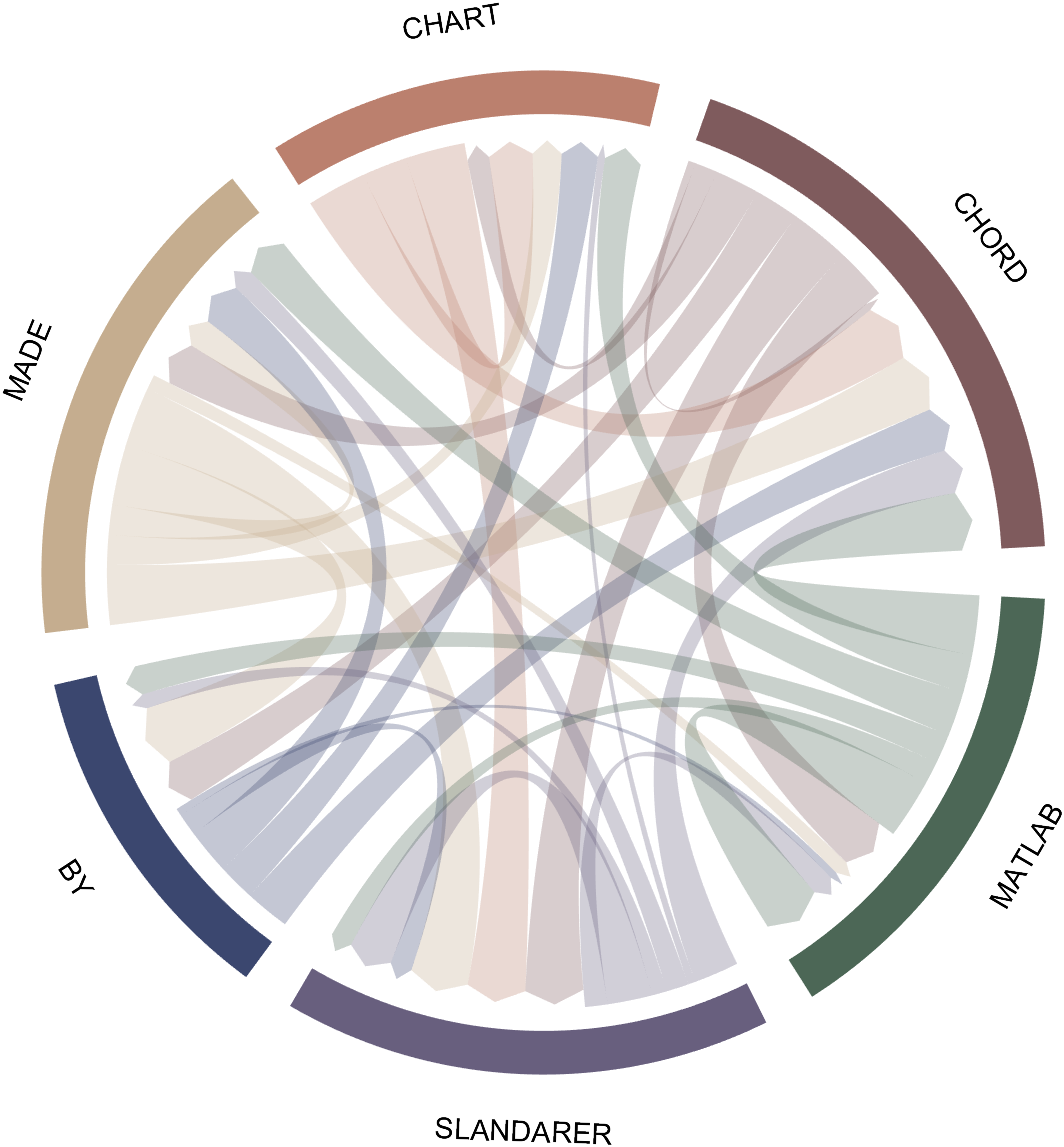
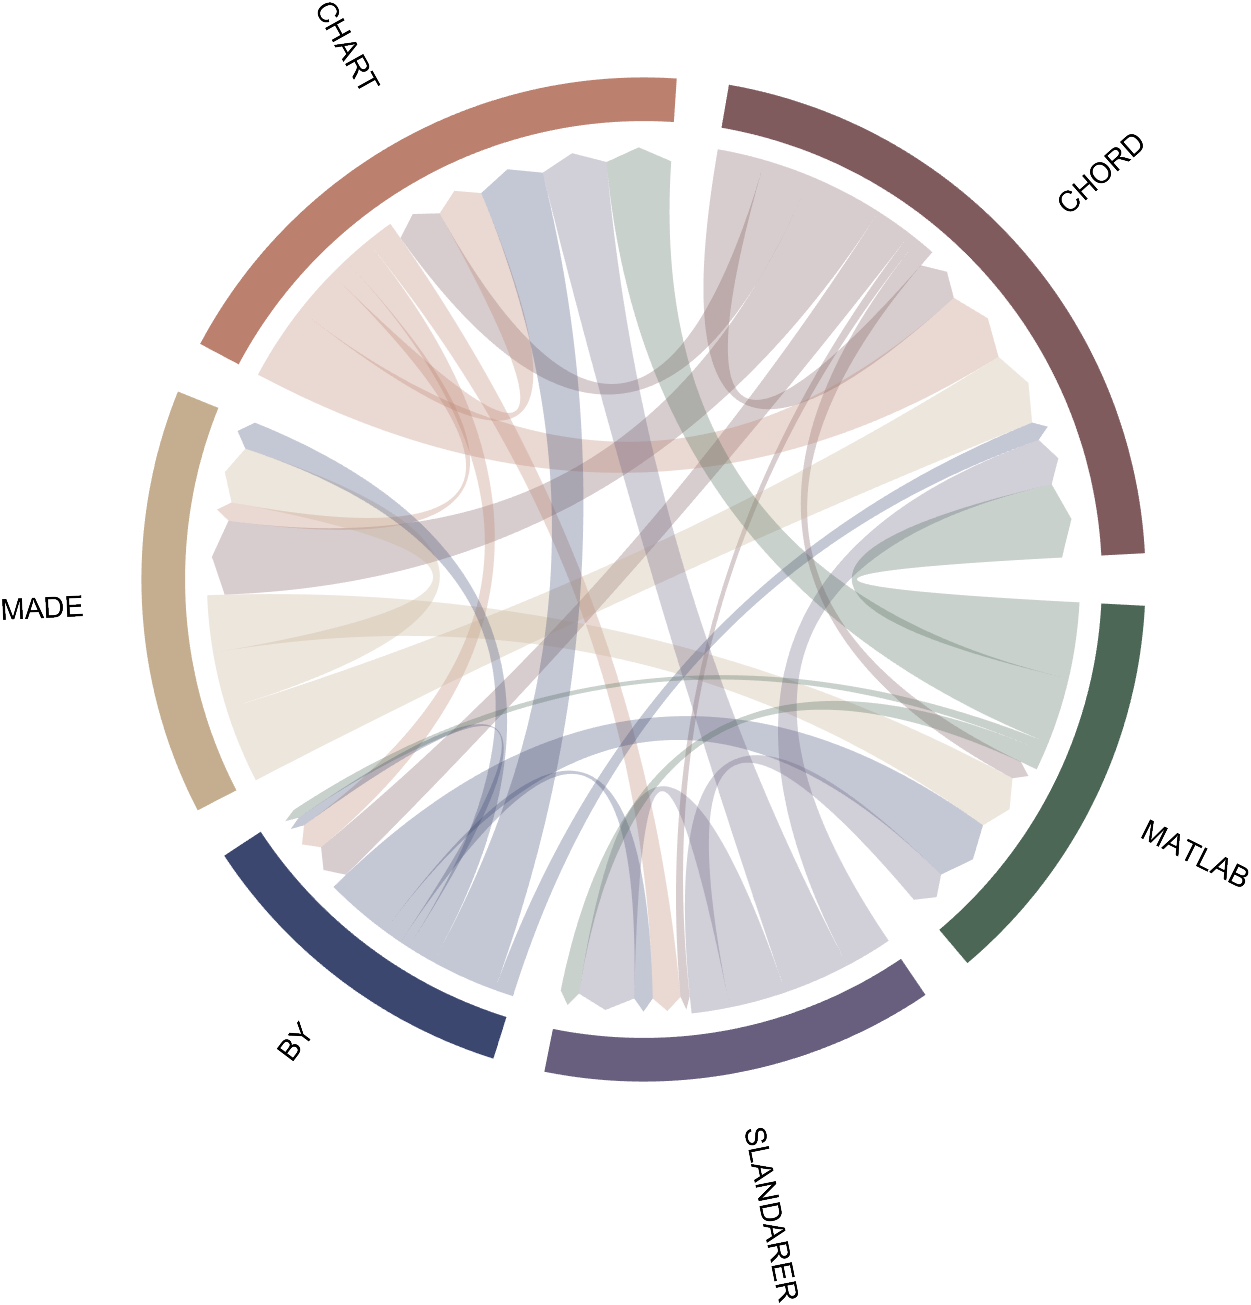
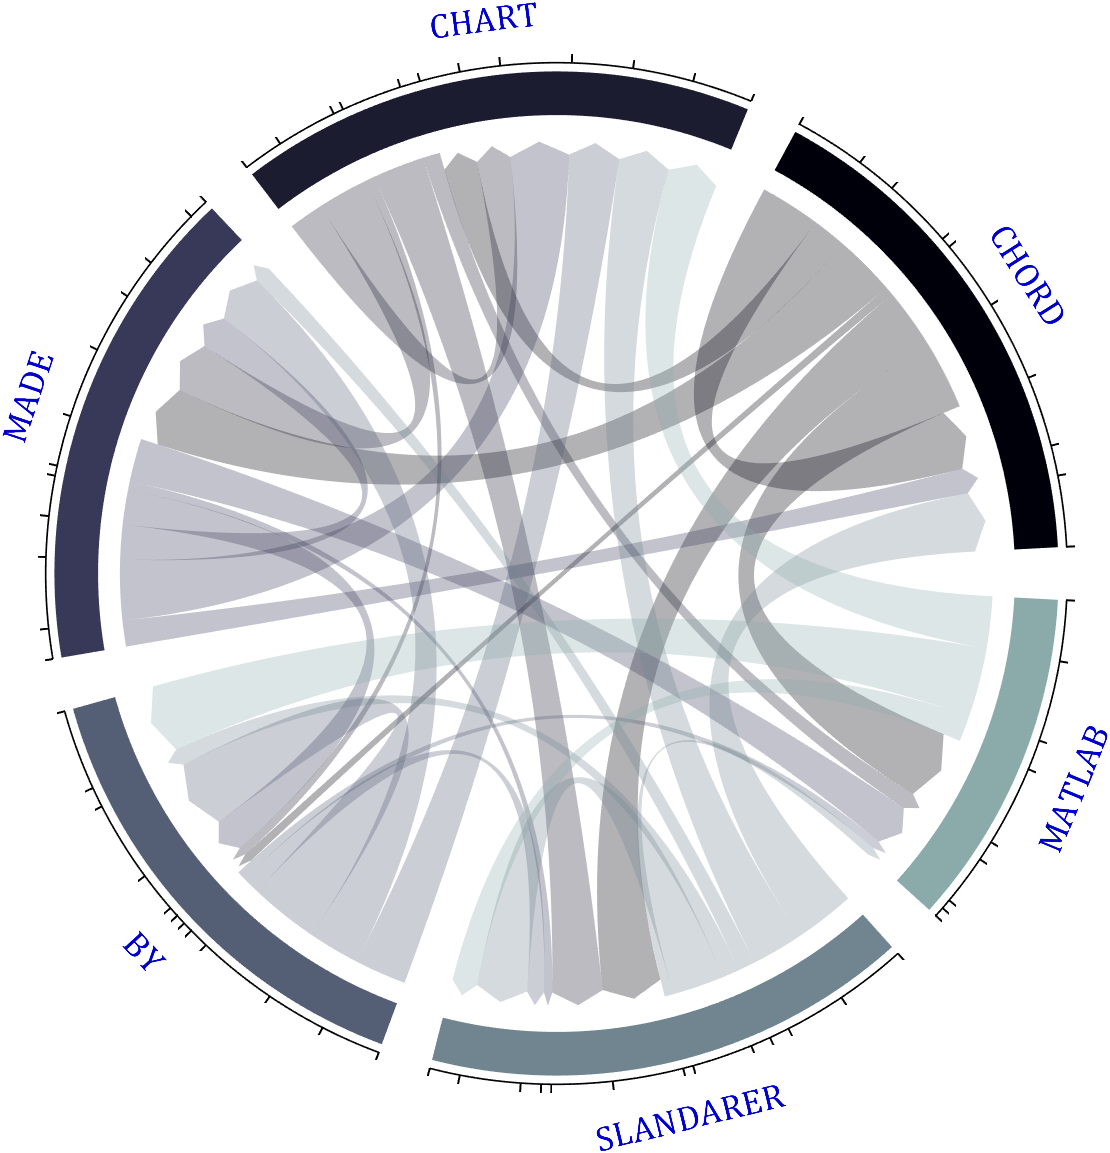
5 修改标签
标签名字默认为C1,C2,C3,...可以通过Label属性进行修改例如:
dataMat=randi([0,8],[6,6]);

% 添加标签名称
NameList={'CHORD','CHART','MADE','BY','SLANDARER','MATLAB'};
BCC=biChordChart(dataMat,'Label',NameList,'Arrow','on');
BCC=BCC.draw();
6 旋转标签
懒得集成进函数里了,请使用以下这段稍显麻烦的代码:
dataMat=randi([0,8],[6,6]);

% 添加标签名称
NameList={'CHORD','CHART','MADE','BY','SLANDARER','MATLAB'};
BCC=biChordChart(dataMat,'Label',NameList,'Arrow','on');
BCC=BCC.draw();

% 以下代码用来旋转标签
% The following code is used to rotate the label
textHdl=findobj(gca,'Type','Text');
for i=1:length(textHdl)
    if textHdl(i).Rotation<-90
        textHdl(i).Rotation=textHdl(i).Rotation+180;
    end
    switch true
        case textHdl(i).Rotation<0&&textHdl(i).Position(2)>0
            textHdl(i).Rotation=textHdl(i).Rotation+90;
            textHdl(i).HorizontalAlignment='left';
        case textHdl(i).Rotation>0&&textHdl(i).Position(2)>0
            textHdl(i).Rotation=textHdl(i).Rotation-90;
            textHdl(i).HorizontalAlignment='right';
        case textHdl(i).Rotation<0&&textHdl(i).Position(2)<0
            textHdl(i).Rotation=textHdl(i).Rotation+90;
            textHdl(i).HorizontalAlignment='right';
        case textHdl(i).Rotation>0&&textHdl(i).Position(2)<0
            textHdl(i).Rotation=textHdl(i).Rotation-90;
            textHdl(i).HorizontalAlignment='left';
    end
end
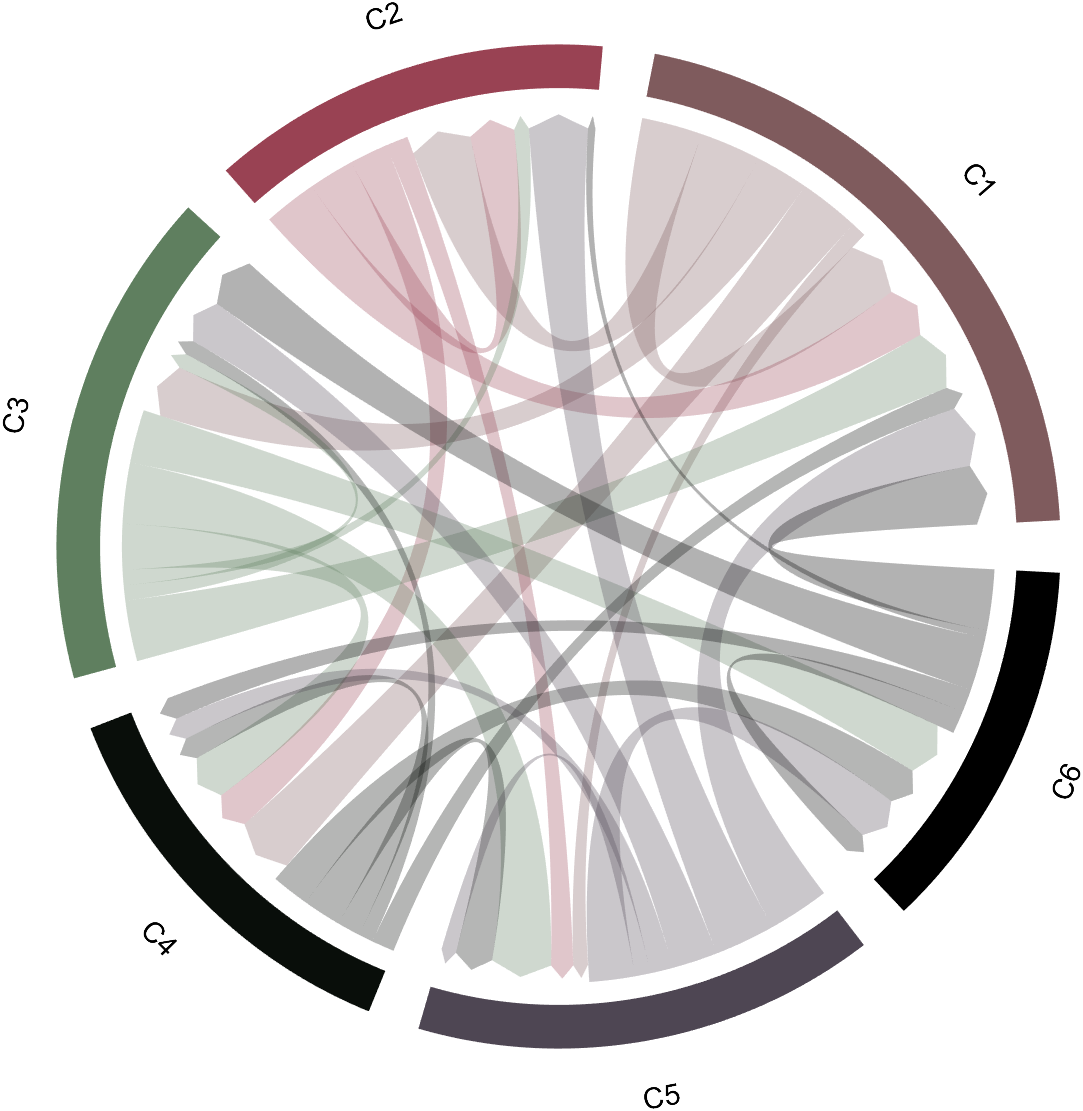
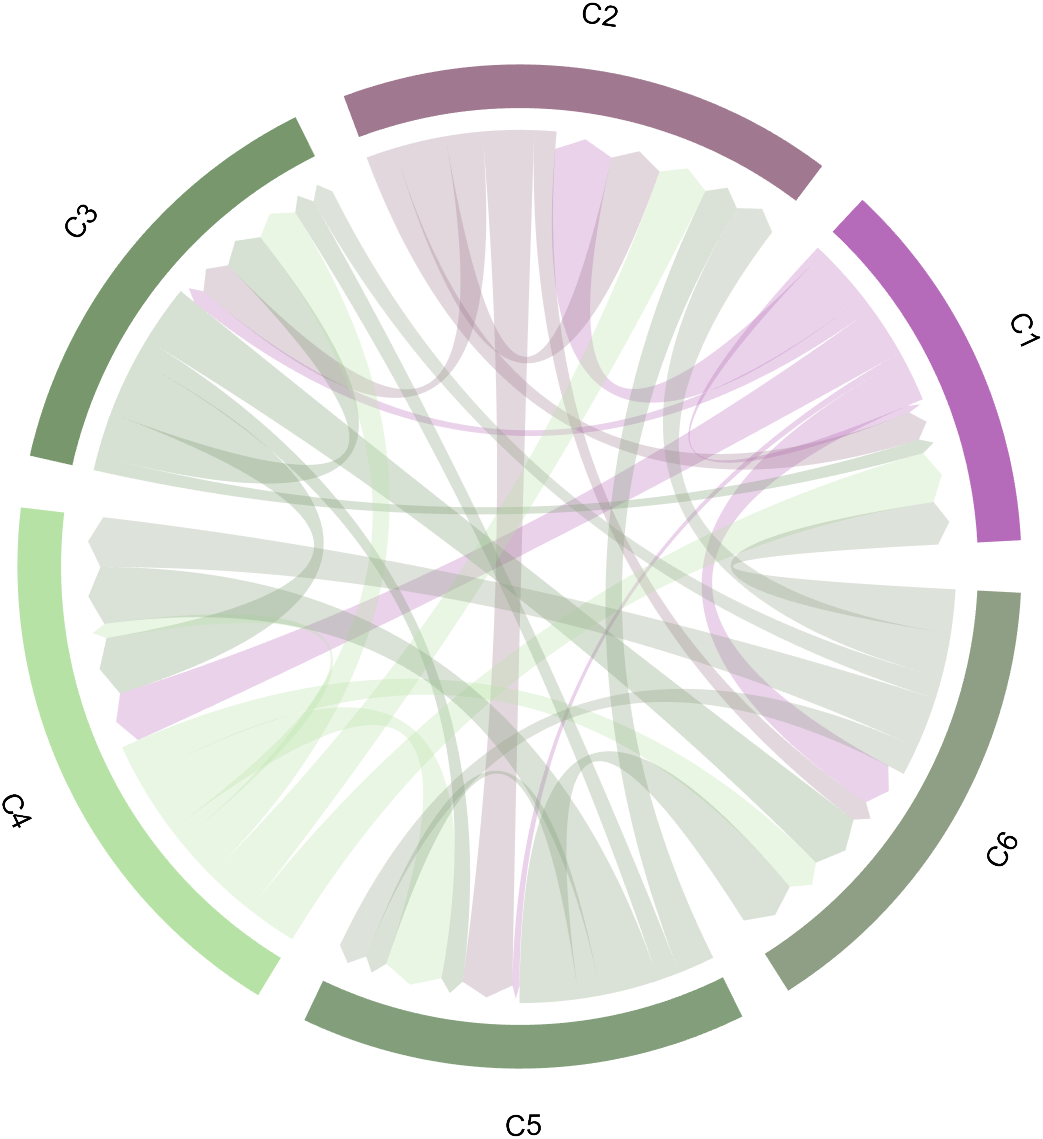
7 颜色的设置
可在draw绘图之前设置CData属性修改颜色,例如:
dataMat=randi([0,8],[6,6]);

ColorList=[127,91,93;153,66,83;95,127,95;9,14,10;78,70,83;0,0,0]./255;
BCC=biChordChart(dataMat,'Arrow','on','CData',ColorList);
BCC=BCC.draw();
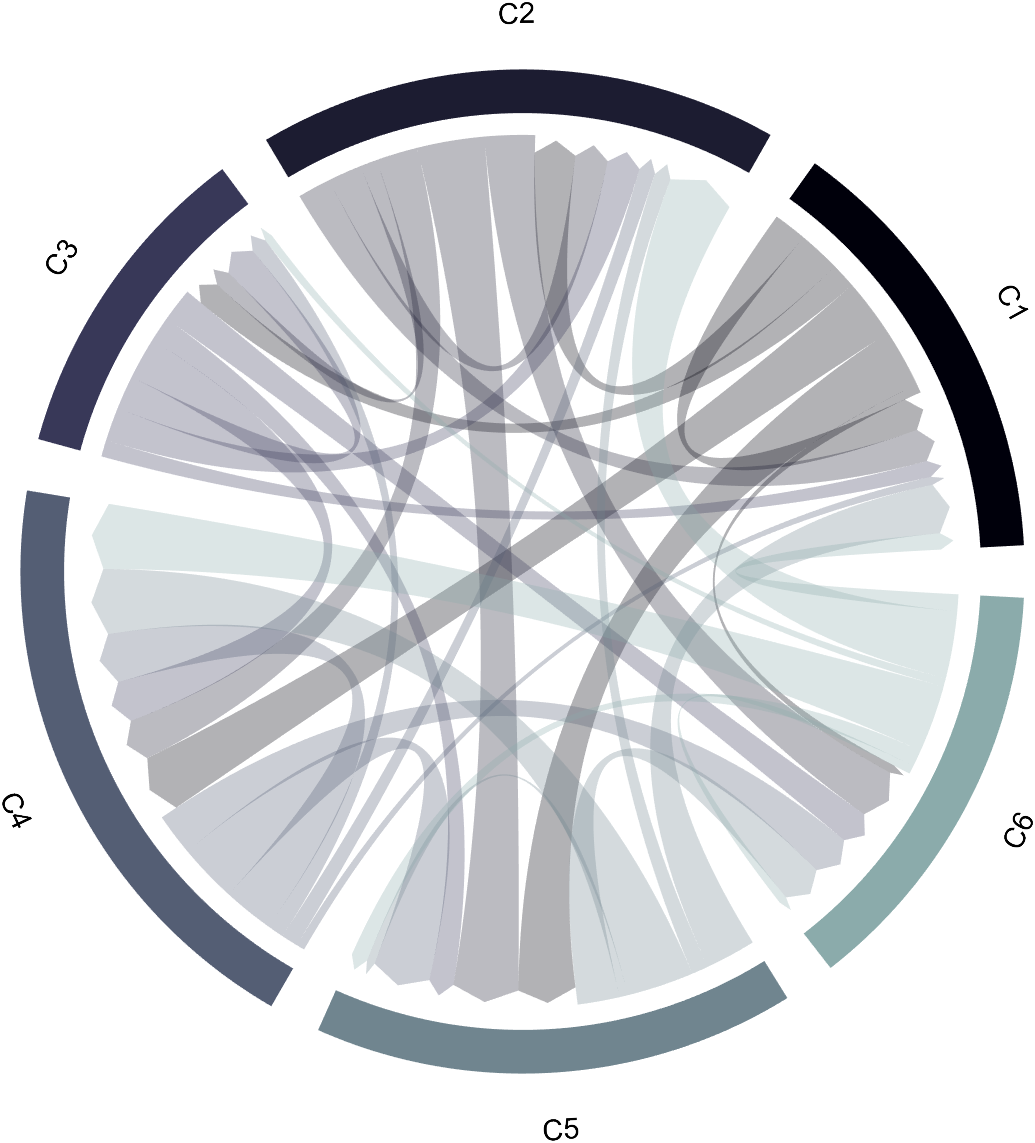
dataMat=randi([0,8],[6,6]);

BCC=biChordChart(dataMat,'Arrow','on','CData',bone(9));
BCC=BCC.draw();
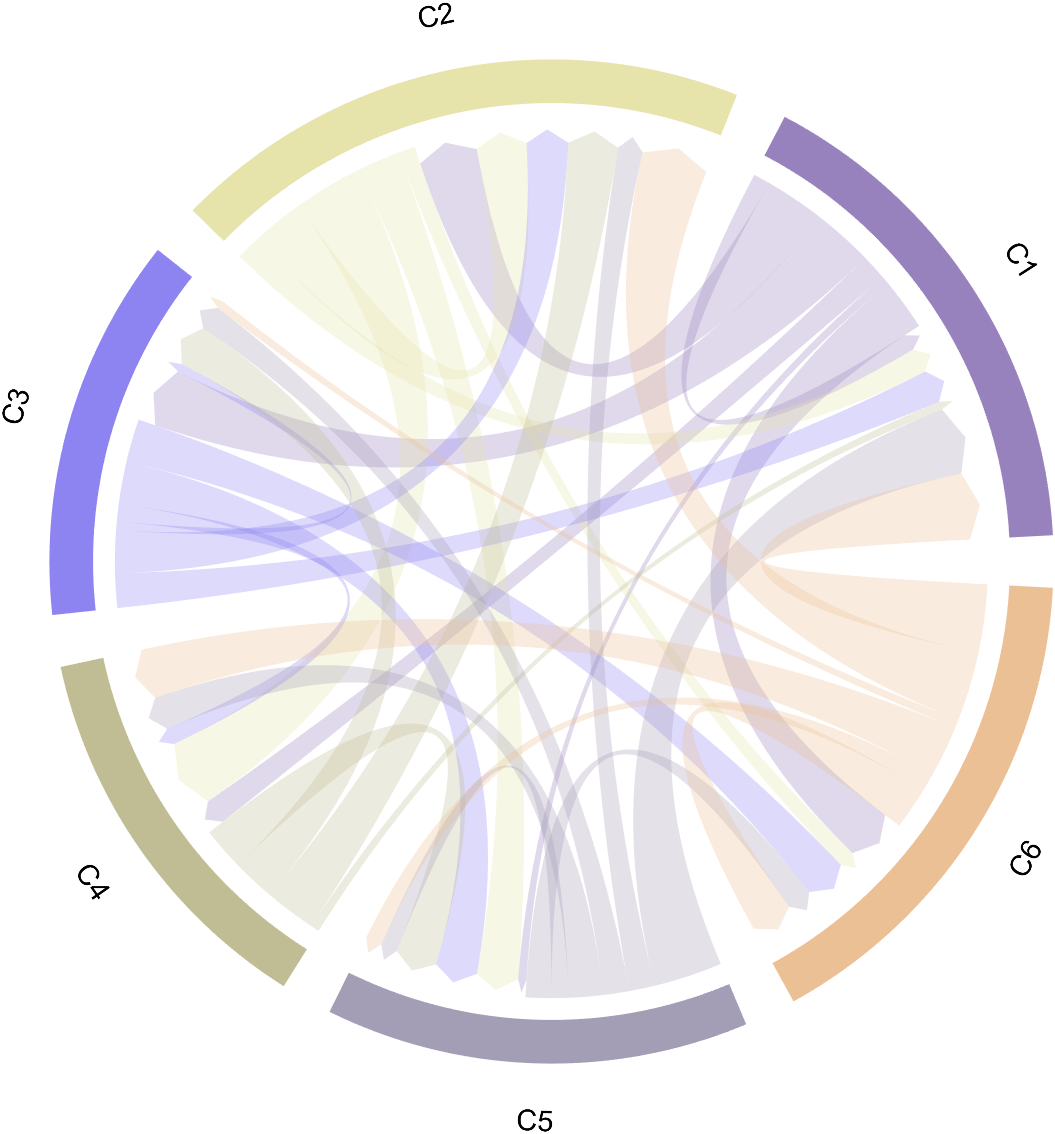
值得一提的是如果CData设置为空集,则会随机生成颜色:
dataMat=randi([0,8],[6,6]);

BCC=biChordChart(dataMat,'Arrow','on','CData',[]);
BCC=BCC.draw();
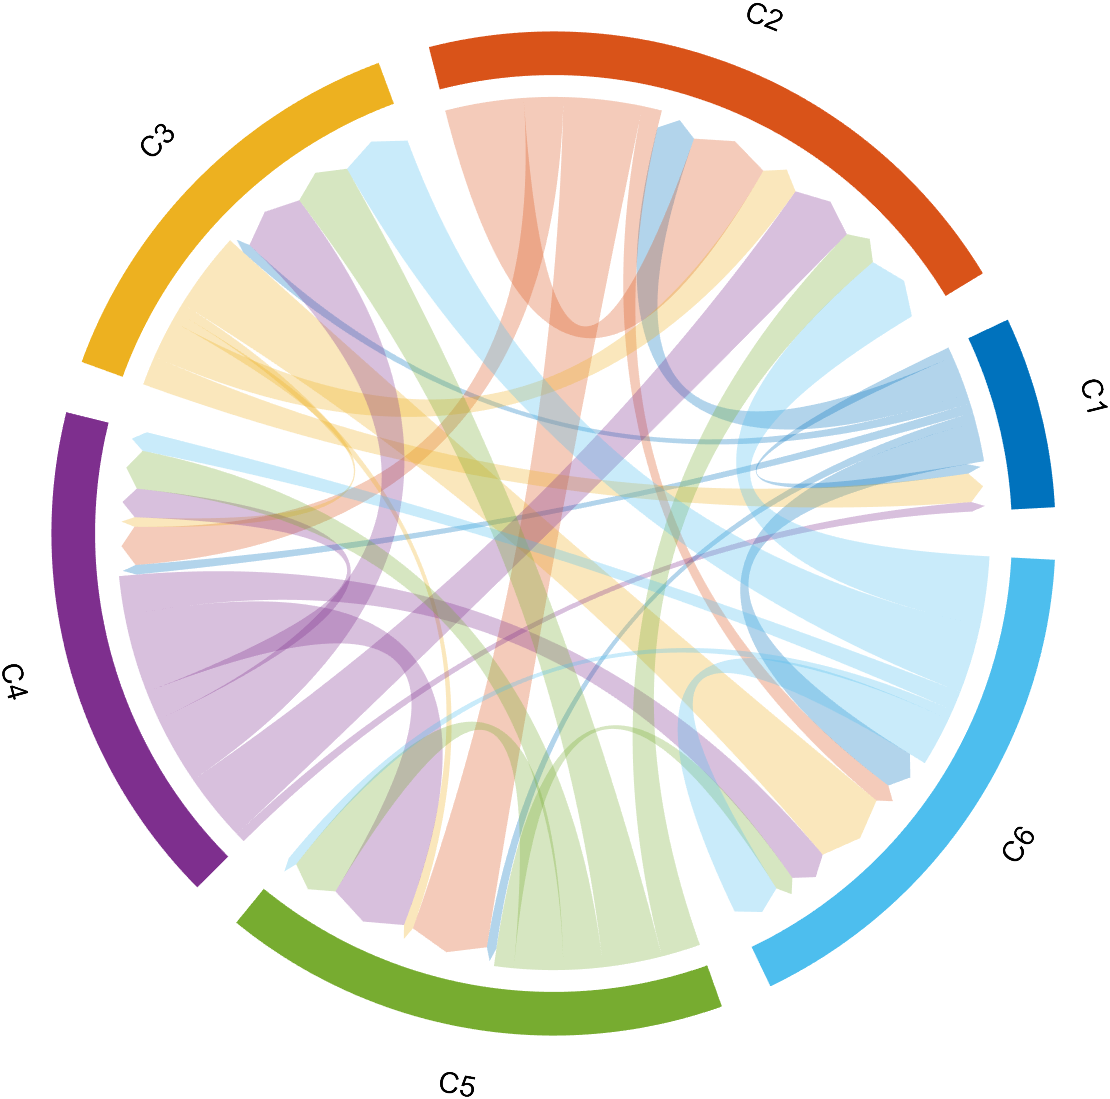
8 弧块及弦属性设置
通过
- BCC.setSquareN
- BCC.setChordN
设置第n个弧块或第n类弦的属性,Patch对象具有的属性均可被设置,比如如果没提前定义颜色,可以比较麻烦的修改颜色:
dataMat=randi([0,8],[6,6]);

BCC=biChordChart(dataMat,'Arrow','on');
BCC=BCC.draw();

ColorList=lines(6);
for i=1:6
    BCC.setSquareN(i,'FaceColor',ColorList(i,:))
    BCC.setChordN(i,'FaceColor',ColorList(i,:))
end
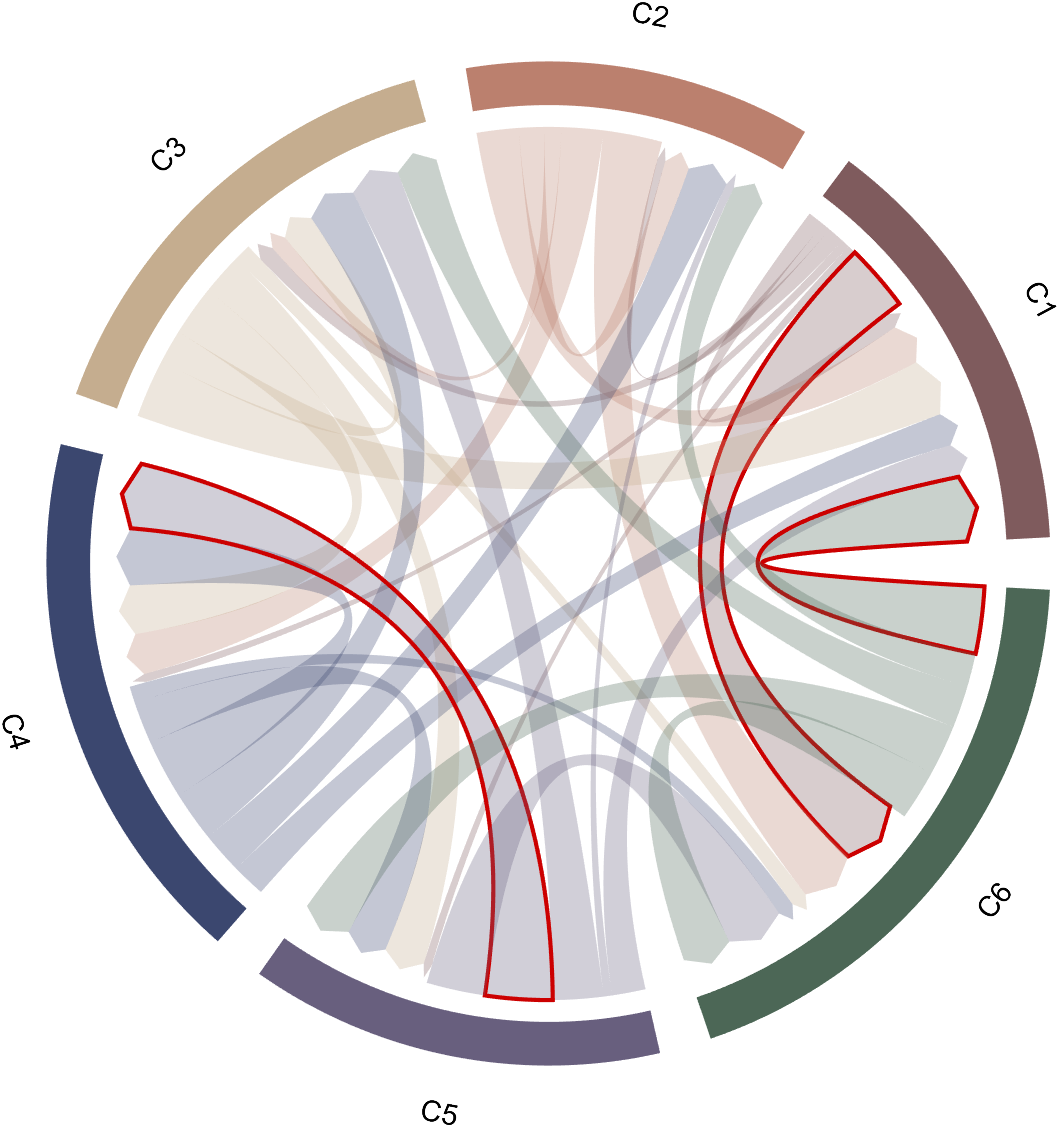
使用函数:
- setChordMN
函数可以单独修饰类m到类n的属性,例如找到比较大的弦并将边缘标记为红色:
dataMat=randi([0,8],[6,6]);

BCC=biChordChart(dataMat,'Arrow','on');
BCC=BCC.draw();

% 标记最大值弦
[m,n]=find(dataMat==max(max(dataMat)));
for i=1:length(m)
    BCC.setChordMN(m(i),n(i),'EdgeColor',[.8,0,0],'LineWidth',2)
end
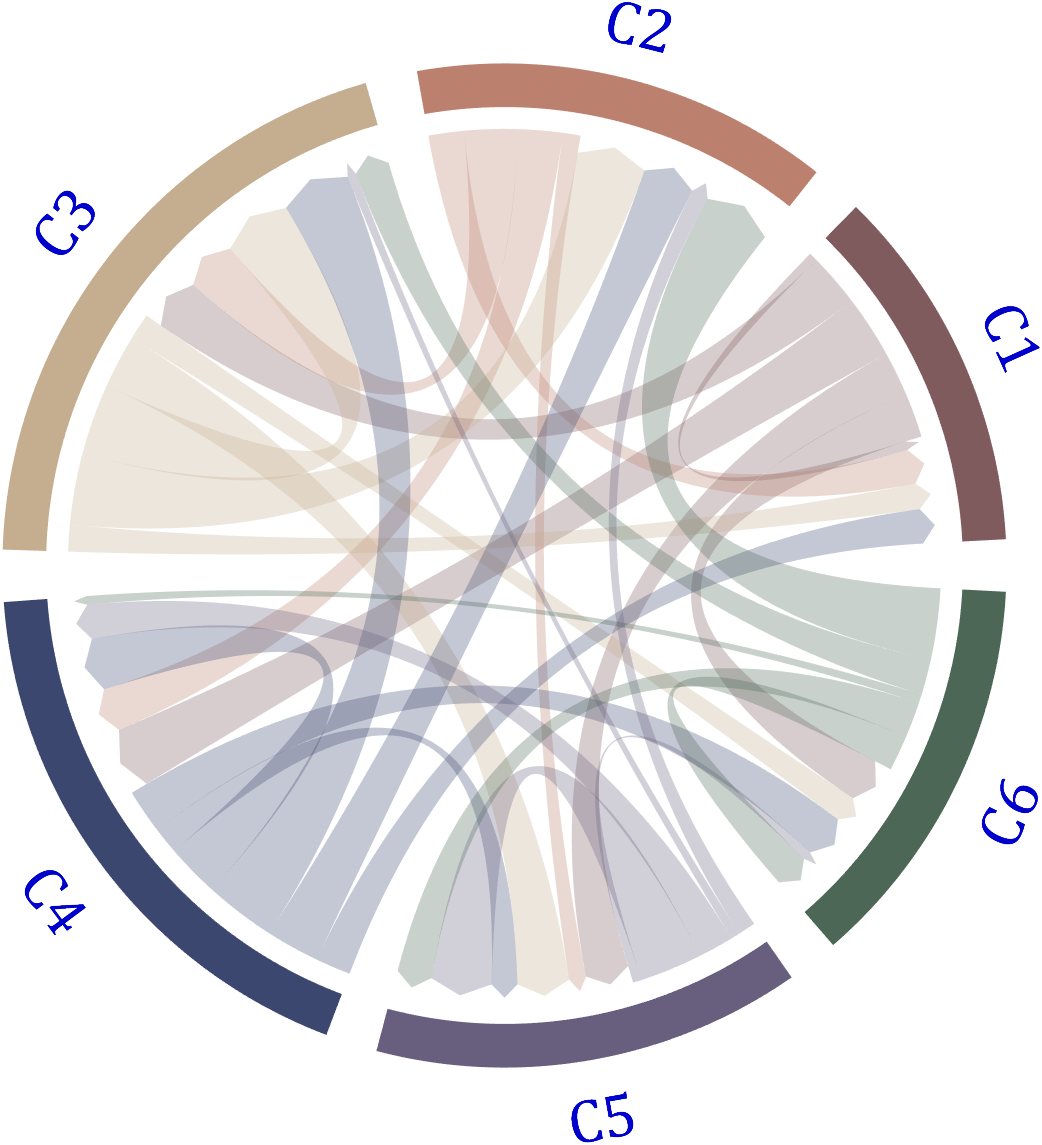
9 字体设置
通过:
- setFont
函数进行字体设置:
dataMat=randi([0,8],[6,6]);

BCC=biChordChart(dataMat,'Arrow','on');
BCC=BCC.draw();

% 修改字体,字号及颜色
BCC.setFont('FontName','Cambria','FontSize',30,'Color',[0,0,.8])
封面绘制
封面1
% @author : slandarer
% 公众号  : slandarer随笔
% 知乎    : slandarer
dataMat=randi([0,8],[6,6]);

BCC=biChordChart(dataMat,'Arrow','on');
BCC=BCC.draw();

% 添加刻度
BCC.tickState('on')

% 修改字体,字号及颜色
BCC.setFont('FontName','Cambria','FontSize',17)
封面2
% @author : slandarer
% 公众号  : slandarer随笔
% 知乎    : slandarer
dataMat=randi([0,8],[6,6]);

% 添加标签名称
NameList={'CHORD','CHART','MADE','BY','SLANDARER','MATLAB'};
BCC=biChordChart(dataMat,'Label',NameList,'Arrow','on','CData',bone(9));
BCC=BCC.draw();


% 添加刻度
BCC.tickState('on')

% 修改字体,字号及颜色
BCC.setFont('FontName','Cambria','FontSize',17,'Color',[0,0,.8])
非常短的代码就能绘制出效果不错的图!!
完整代码
classdef biChordChart < handle
% Copyright (c) 2022-2024, Zhaoxu Liu / slandarer
% =========================================================================
% @author : slandarer
% 公众号 : slandarer随笔
% 知乎 : slandarer
% -------------------------------------------------------------------------
% Zhaoxu Liu / slandarer (2024). Digraph chord chart 有向弦图
% (https://www.mathworks.com/matlabcentral/fileexchange/121043-digraph-chord-chart),
% MATLAB Central File Exchange. 检索来源 2024/3/31.
%
% =========================================================================
% 使用示例:
% -------------------------------------------------------------------------
% dataMat = randi([0,8], [6,6]);
%
% BCC = biChordChart(dataMat, 'Arrow','on');
% BCC = BCC.draw();
%
% % 添加刻度
% BCC.tickState('on')
%
% % 修改字体,字号及颜色
% BCC.setFont('FontName','Cambria', 'FontSize',17)
% =========================================================================
% 版本更新:
% -------------------------------------------------------------------------
% # version 1.1.0
% + 增添了可调节标签半径的属性'LRadius'
% Added attribute 'LRadius' with adjustable Label radius
% + 增添了可调节标签旋转的属性'LRotate'及函数 `labelRatato`(demo3)
% Added attribute 'LRotate' and function `labelRatato` with adjustable Label rotate(demo3)
% + 可使用函数`tickLabelState`显示刻度标签(demo4)
% Use function `tickLabelState` to display tick labels(demo4)
% -------------------------------------------------------------------------
% # version 2.0.0
% + 新增两种标志刻度的方法
% Added 2 methods to adjust ticks
% try : CC = chordChart(..., 'TickMode','auto', ...)
%
% + 'value' : default
%
% + 'auto' : 当有刻度离得很近的时候,绘制斜线将其距离拉远
% When there are scales that are very close, draw a diagonal line
% to distance them further apart
% + 'linear' : 均匀的绘制刻度线
% Draw tick marks evenly
%
% Properties related to linear scales
% % 刻度的设置要在draw()之前
% % the setting of tick should before draw()
% % 刻度的紧密程度,数值越高刻度线数量越多
% % The compact degree of ticks, The higher the value, the more scales there are
% BCC.linearTickCompactDegree = 2;
% % 是否开启次刻度线
% % Minor ticks 'on'/'off'
% BCC.linearMinorTick = 'on';
properties
ax
arginList={'Label','Sep','Arrow','CData','LRadius','LRotate','TickMode'}
dataMat % 数值矩阵
Label={} % 标签文本
% -----------------------------------------------------------
squareHdl % 绘制方块的图形对象矩阵
nameHdl % 绘制下方文本的图形对象矩阵
chordMatHdl % 绘制弦的图形对象矩阵
thetaTickHdl % 刻度句柄
RTickHdl % 轴线句柄
TickMode = 'value' % 'value'/'auto'/'linear'
thetaTickLabelHdl
thetaSet=[];meanThetaSet;rotationSet;thetaFullSet
Sep;Arrow;CData;LRadius=1.28;LRotate='off'
linearTickSep, linearTickCompactDegree = 3.5, linearMinorTick = 'off';
end
methods
function obj=biChordChart(varargin)
obj.Sep=1/10;
obj.Arrow='off';
obj.CData=[127,91,93;187,128,110;197,173,143;59,71,111;104,95,126;76,103,86;112,112,124;
72,39,24;197,119,106;160,126,88;238,208,146]./255;
if isa(varargin{1},'matlab.graphics.axis.Axes')
obj.ax=varargin{1};varargin(1)=[];
else
obj.ax=gca;
end
obj.ax.NextPlot='add';
obj.dataMat=varargin{1};varargin(1)=[];
% 获取其他数据
for i=1:2:(length(varargin)-1)
tid=ismember(lower(obj.arginList), lower(varargin{i}));
if any(tid)
obj.(obj.arginList{tid})=varargin{i+1};
end
end
% 名称标签预设
if isempty(obj.Label)||length(obj.Label)<size(obj.dataMat,1)
obj.Label = compose('C%d', 1:size(obj.dataMat, 1));
end
% 调整不合理间隙
if obj.Sep>1/10
obj.Sep=1/10;
end
% 调整颜色数量
if size(obj.CData,1)<size(obj.dataMat,1)
obj.CData=[obj.CData;rand([size(obj.dataMat,1),3]).*.5+ones([size(obj.dataMat,1),3]).*.5];
end
% 调整对角线
for i=1:size(obj.dataMat,1)
obj.dataMat(i,i)=abs(obj.dataMat(i,i));
end
% 调整标签间距
if obj.LRadius>2||obj.LRadius<1.2
obj.LRadius=1.28;
end
help biChordChart
end
function obj=draw(obj)
obj.ax.XLim=[-1.38,1.38];
obj.ax.YLim=[-1.38,1.38];
obj.ax.XTick=[];
obj.ax.YTick=[];
obj.ax.XColor='none';
obj.ax.YColor='none';
obj.ax.PlotBoxAspectRatio=[1,1,1];
% 计算比例
numC=size(obj.dataMat,1);
ratioC1=sum(abs(obj.dataMat),2)./sum(sum(abs(obj.dataMat)));
ratioC2=sum(abs(obj.dataMat),1)./sum(sum(abs(obj.dataMat)));
ratioC=(ratioC1'+ratioC2)./2;
ratioC=[0,ratioC];
% version 2.0.0 更新部分
obj.linearTickSep = obj.getTick(sum(sum(obj.dataMat))./(size(obj.dataMat,1)+size(obj.dataMat,2)).*2, obj.linearTickCompactDegree);
sepLen=(2*pi*obj.Sep)./numC;
baseLen=2*pi*(1-obj.Sep);
% 绘制方块
for i=1:numC
theta1=sepLen/2+sum(ratioC(1:i))*baseLen+(i-1)*sepLen;
theta2=sepLen/2+sum(ratioC(1:i+1))*baseLen+(i-1)*sepLen;
theta=linspace(theta1,theta2,100);
X=cos(theta);Y=sin(theta);
obj.squareHdl(i)=fill([1.05.*X,1.15.*X(end:-1:1)],[1.05.*Y,1.15.*Y(end:-1:1)],...
obj.CData(i,:),'EdgeColor','none');
theta3=(theta1+theta2)/2;
obj.meanThetaSet(i)=theta3;
rotation=theta3/pi*180;
if rotation>0&&rotation<180
obj.nameHdl(i)=text(cos(theta3).*obj.LRadius,sin(theta3).*obj.LRadius,obj.Label{i},'FontSize',14,'FontName','Arial',...
'HorizontalAlignment','center','Rotation',-(.5*pi-theta3)./pi.*180,'Tag','BiChordLabel');
obj.rotationSet(i)=-(.5*pi-theta3)./pi.*180;
else
obj.nameHdl(i)=text(cos(theta3).*obj.LRadius,sin(theta3).*obj.LRadius,obj.Label{i},'FontSize',14,'FontName','Arial',...
'HorizontalAlignment','center','Rotation',-(1.5*pi-theta3)./pi.*180,'Tag','BiChordLabel');
obj.rotationSet(i)=-(1.5*pi-theta3)./pi.*180;
end
obj.RTickHdl(i)=plot(cos(theta).*1.17,sin(theta).*1.17,'Color',[0,0,0],'LineWidth',.8,'Visible','off');
end
for i=1:numC
for j=1:numC
theta_i_1=sepLen/2+sum(ratioC(1:i))*baseLen+(i-1)*sepLen;
theta_i_2=sepLen/2+sum(ratioC(1:i+1))*baseLen+(i-1)*sepLen;
theta_i_3=theta_i_1+(theta_i_2-theta_i_1).*sum(abs(obj.dataMat(:,i)))./(sum(abs(obj.dataMat(:,i)))+sum(abs(obj.dataMat(i,:))));
theta_j_1=sepLen/2+sum(ratioC(1:j))*baseLen+(j-1)*sepLen;
theta_j_2=sepLen/2+sum(ratioC(1:j+1))*baseLen+(j-1)*sepLen;
theta_j_3=theta_j_1+(theta_j_2-theta_j_1).*sum(abs(obj.dataMat(:,j)))./(sum(abs(obj.dataMat(:,j)))+sum(abs(obj.dataMat(j,:))));
ratio_i_1=obj.dataMat(i,:);ratio_i_1=[0,ratio_i_1./sum(ratio_i_1)];
ratio_j_2=obj.dataMat(:,j)';ratio_j_2=[0,ratio_j_2./sum(ratio_j_2)];
if true
theta1=theta_i_2+(theta_i_3-theta_i_2).*sum(ratio_i_1(1:j));
theta2=theta_i_2+(theta_i_3-theta_i_2).*sum(ratio_i_1(1:j+1));
theta3=theta_j_3+(theta_j_1-theta_j_3).*sum(ratio_j_2(1:i));
theta4=theta_j_3+(theta_j_1-theta_j_3).*sum(ratio_j_2(1:i+1));
tPnt1=[cos(theta1),sin(theta1)];
tPnt2=[cos(theta2),sin(theta2)];
tPnt3=[cos(theta3),sin(theta3)];
tPnt4=[cos(theta4),sin(theta4)];
obj.thetaFullSet{i}(j)=theta1;
obj.thetaFullSet{i}(j+1)=theta2;
obj.thetaFullSet{j}(i+numC)=theta3;
obj.thetaFullSet{j}(i+numC+1)=theta4;
if strcmp(obj.Arrow,'off')
% 计算贝塞尔曲线
tLine1=bezierCurve([tPnt1;0,0;tPnt4],200);
tLine2=bezierCurve([tPnt2;0,0;tPnt3],200);
tline3=[cos(linspace(theta2,theta1,100))',sin(linspace(theta2,theta1,100))'];
tline4=[cos(linspace(theta4,theta3,100))',sin(linspace(theta4,theta3,100))'];
else
% 计算贝塞尔曲线
tLine1=bezierCurve([tPnt1;0,0;tPnt4.*.96],200);
tLine2=bezierCurve([tPnt2;0,0;tPnt3.*.96],200);
tline3=[cos(linspace(theta2,theta1,100))',sin(linspace(theta2,theta1,100))'];
tline4=[cos(theta4).*.96,sin(theta4).*.96;
cos(theta3/2+theta4/2).*.99,sin(theta3/2+theta4/2).*.99;
cos(theta3).*.96,sin(theta3).*.96];
end
obj.chordMatHdl(i,j)=fill([tLine1(:,1);tline4(:,1);tLine2(end:-1:1,1);tline3(:,1)],...
[tLine1(:,2);tline4(:,2);tLine2(end:-1:1,2);tline3(:,2)],...
obj.CData(i,:),'FaceAlpha',.3,'EdgeColor','none');
else
end
end
end
for i = 1:numC
tTFS = obj.thetaFullSet{i};
isNANListF{i} = isnan(tTFS);
obj.thetaFullSet{i} = tTFS(~isNANListF{i});
end
% #############################################################
% version 2.0.0 更新部分
% 绘制刻度线
for i = 1:numC
[obj.thetaFullSet{i}, uniListF{i}] = unique(obj.thetaFullSet{i}, 'stable');
end
switch lower(obj.TickMode)
case 'value'
tickX = [cos([obj.thetaFullSet{:}]).*1.17; cos([obj.thetaFullSet{:}]).*1.19; nan.*[obj.thetaFullSet{:}]];
tickY = [sin([obj.thetaFullSet{:}]).*1.17; sin([obj.thetaFullSet{:}]).*1.19; nan.*[obj.thetaFullSet{:}]];
case 'auto'
for i = 1:numC
tTFS0{i} = obj.thetaFullSet{i};
for k = 1:3
tTFS1{i} = obj.thetaFullSet{i};
tTFSA = abs(diff(tTFS1{i}));
tTFSB = [inf, tTFSA] < mean(tTFSA)/2 | [tTFSA, inf] < mean(tTFSA)/2;
tTFS2 = linspace(tTFS1{i}(1), tTFS1{i}(end), length(tTFS1{i}));
tTFSC = tTFS1{i}; tTFSC(tTFSB) = tTFS2(tTFSB);
tTFSC(tTFSC > tTFS1{i} + pi/30) = tTFS1{i}(tTFSC > tTFS1{i} + pi/30) + pi/30;
tTFSC(tTFSC < tTFS1{i} - pi/30) = tTFS1{i}(tTFSC < tTFS1{i} - pi/30) - pi/30;
obj.thetaFullSet{i} = sort((2.*tTFS1{i} + tTFSC)./3, 'descend');
end
end
tickX = [cos([tTFS0{:}]).*1.17; cos([tTFS0{:}]).*(1.17 + 1/3*.02); cos([obj.thetaFullSet{:}]).*(1.17 + 2/3*.02); cos([obj.thetaFullSet{:}]).*1.19; nan.*[obj.thetaFullSet{:}]];
tickY = [sin([tTFS0{:}]).*1.17; sin([tTFS0{:}]).*(1.17 + 1/3*.02); sin([obj.thetaFullSet{:}]).*(1.17 + 2/3*.02); sin([obj.thetaFullSet{:}]).*1.19; nan.*[obj.thetaFullSet{:}]];
case 'linear'
for i = 1:numC
tTFS = obj.thetaFullSet{i};
obj.thetaFullSet{i} = (tTFS(end) - tTFS(1))./(sum(obj.dataMat(i,:)) + sum(obj.dataMat(:,i))).*(0:obj.linearTickSep:(sum(obj.dataMat(i,:)) + sum(obj.dataMat(:,i)))) + tTFS(1);
tMTFS{i} = (tTFS(end) - tTFS(1))./(sum(obj.dataMat(i,:)) + sum(obj.dataMat(:,i))).*(0:obj.linearTickSep/5:(sum(obj.dataMat(i,:)) + sum(obj.dataMat(:,i)))) + tTFS(1);
end
if strcmp(obj.linearMinorTick, 'on')
tickX = [cos([tMTFS{:}]).*1.17, cos([obj.thetaFullSet{:}]).*1.17; cos([tMTFS{:}]).*1.18, cos([obj.thetaFullSet{:}]).*1.19; nan.*[[obj.thetaFullSet{:}],[tMTFS{:}]]];
tickY = [sin([tMTFS{:}]).*1.17, sin([obj.thetaFullSet{:}]).*1.17; sin([tMTFS{:}]).*1.18, sin([obj.thetaFullSet{:}]).*1.19; nan.*[[obj.thetaFullSet{:}],[tMTFS{:}]]];
else
tickX = [cos([obj.thetaFullSet{:}]).*1.17; cos([obj.thetaFullSet{:}]).*1.19; nan.*[obj.thetaFullSet{:}]];
tickY = [sin([obj.thetaFullSet{:}]).*1.17; sin([obj.thetaFullSet{:}]).*1.19; nan.*[obj.thetaFullSet{:}]];
end
end
obj.thetaTickHdl = plot(tickX(:),tickY(:), 'Color',[0,0,0], 'LineWidth',.8, 'Visible','off');
% #############################################################
% version 1.1.0 更新部分
for i=1:numC
if strcmpi(obj.TickMode,'linear')
cumsumV=0:obj.linearTickSep:(sum(obj.dataMat(i,:)) + sum(obj.dataMat(:,i)));
else
cumsumV=[0,cumsum([obj.dataMat(i,:),obj.dataMat(:,i).'])];
cumsumV=cumsumV(~isNANListF{i});
cumsumV=cumsumV(uniListF{i});
end
for j=1:length(obj.thetaFullSet{i})
rotation=obj.thetaFullSet{i}(j)/pi*180;
if ~isnan(obj.thetaFullSet{i}(j))
if rotation>90&&rotation<270
rotation=rotation+180;
obj.thetaTickLabelHdl(i,j)=text(cos(obj.thetaFullSet{i}(j)).*1.2,sin(obj.thetaFullSet{i}(j)).*1.2,num2str(cumsumV(j)),...
'Rotation',rotation,'HorizontalAlignment','right','FontSize',9,'FontName','Arial','Visible','off','UserData',cumsumV(j));
else
obj.thetaTickLabelHdl(i,j)=text(cos(obj.thetaFullSet{i}(j)).*1.2,sin(obj.thetaFullSet{i}(j)).*1.2,num2str(cumsumV(j)),...
'Rotation',rotation,'FontSize',9,'FontName','Arial','Visible','off','UserData',cumsumV(j));
end
end
end
end
% 贝塞尔函数
function pnts=bezierCurve(pnts,N)
t=linspace(0,1,N);
p=size(pnts,1)-1;
coe1=factorial(p)./factorial(0:p)./factorial(p:-1:0);
coe2=((t).^((0:p)')).*((1-t).^((p:-1:0)'));
pnts=(pnts'*(coe1'.*coe2))';
end
obj.labelRotate(obj.LRotate)
end
% -----------------------------------------------------------------
% 方块属性设置
function setSquareN(obj,n,varargin)
set(obj.squareHdl(n),varargin{:});
end
% -----------------------------------------------------------------
% 批量弦属性设置
function setChordN(obj,n,varargin)
for i=n
for j=1:size(obj.dataMat,2)
set(obj.chordMatHdl(i,j),varargin{:});
end
end
end
% -----------------------------------------------------------------
% 单独弦属性设置
function setChordMN(obj,m,n,varargin)
set(obj.chordMatHdl(m,n),varargin{:});
end
% -----------------------------------------------------------------
% 字体设置
function setFont(obj,varargin)
for i=1:size(obj.dataMat,1)
set(obj.nameHdl(i),varargin{:});
end
end
function setTickFont(obj,varargin)
for m=1:length(obj.thetaFullSet)
for n=1:length(obj.thetaFullSet{m})
if obj.thetaTickLabelHdl(m,n)
set(obj.thetaTickLabelHdl(m,n),varargin{:})
end
end
end
end
% version 1.1.0 更新部分
% 标签文字距离设置
function obj=setLabelRadius(obj,Radius)
obj.LRadius=Radius;
for i=1:size(obj.dataMat,1)
set(obj.nameHdl(i),'Position',[cos(obj.meanThetaSet(i)),sin(obj.meanThetaSet(i))].*obj.LRadius);
end
end
% version 1.1.0 更新部分
% 标签旋转状态设置
function labelRotate(obj,Rotate)
obj.LRotate=Rotate;
for i=1:size(obj.dataMat,1)
set(obj.nameHdl(i),'HorizontalAlignment','center','Rotation',obj.rotationSet(i))
end
if isequal(obj.LRotate,'on')
textHdl=findobj(obj.ax,'Tag','BiChordLabel');
for i=1:length(textHdl)
if textHdl(i).Rotation<-90
textHdl(i).Rotation=textHdl(i).Rotation+180;
end
switch true
case textHdl(i).Rotation<0&&textHdl(i).Position(2)>0
textHdl(i).Rotation=textHdl(i).Rotation+90;
textHdl(i).HorizontalAlignment='left';
case textHdl(i).Rotation>=0&&textHdl(i).Position(2)>0
textHdl(i).Rotation=textHdl(i).Rotation-90;
textHdl(i).HorizontalAlignment='right';
case textHdl(i).Rotation<0&&textHdl(i).Position(2)<=0
textHdl(i).Rotation=textHdl(i).Rotation+90;
textHdl(i).HorizontalAlignment='right';
case textHdl(i).Rotation>=0&&textHdl(i).Position(2)<=0
textHdl(i).Rotation=textHdl(i).Rotation-90;
textHdl(i).HorizontalAlignment='left';
end
end
end
end
% -----------------------------------------------------------------
% 刻度开关
function tickState(obj,state)
for i=1:size(obj.dataMat,1)
set(obj.RTickHdl(i),'Visible',state);
end
set(obj.thetaTickHdl,'Visible',state);
end
% version 1.1.0 更新部分
function tickLabelState(obj,state)
for m=1:length(obj.thetaFullSet)
for n=1:length(obj.thetaFullSet{m})
if obj.thetaTickLabelHdl(m,n)
if ~(n<length(obj.thetaFullSet{m})&&abs(obj.thetaFullSet{m}(n)-obj.thetaFullSet{m}(n+1))<eps)
set(obj.thetaTickLabelHdl(m,n),'Visible',state)
end
end
end
end
end
function setTickLabelFormat(obj,func)
for m=1:length(obj.thetaFullSet)
for n=1:length(obj.thetaFullSet{m})
if obj.thetaTickLabelHdl(m,n)
tStr=func(get(obj.thetaTickLabelHdl(m,n),'UserData'));
set(obj.thetaTickLabelHdl(m,n),'String',tStr)
end
end
end
end
% -----------------------------------------------------------------
% 功能函数
function tXS = getTick(~, Len, N)
tXS = Len / N;
tXN = ceil(log(tXS) / log(10));
tXS = round(round(tXS / 10^(tXN-2)) / 5) * 5 * 10^(tXN-2);
end
end
% @author : slandarer
% 公众号 : slandarer随笔
% 知乎 : slandarer
% -------------------------------------------------------------------------
% Zhaoxu Liu / slandarer (2024). Digraph chord chart 有向弦图
% (https://www.mathworks.com/matlabcentral/fileexchange/121043-digraph-chord-chart),
% MATLAB Central File Exchange. 检索来源 2024/3/31.
end
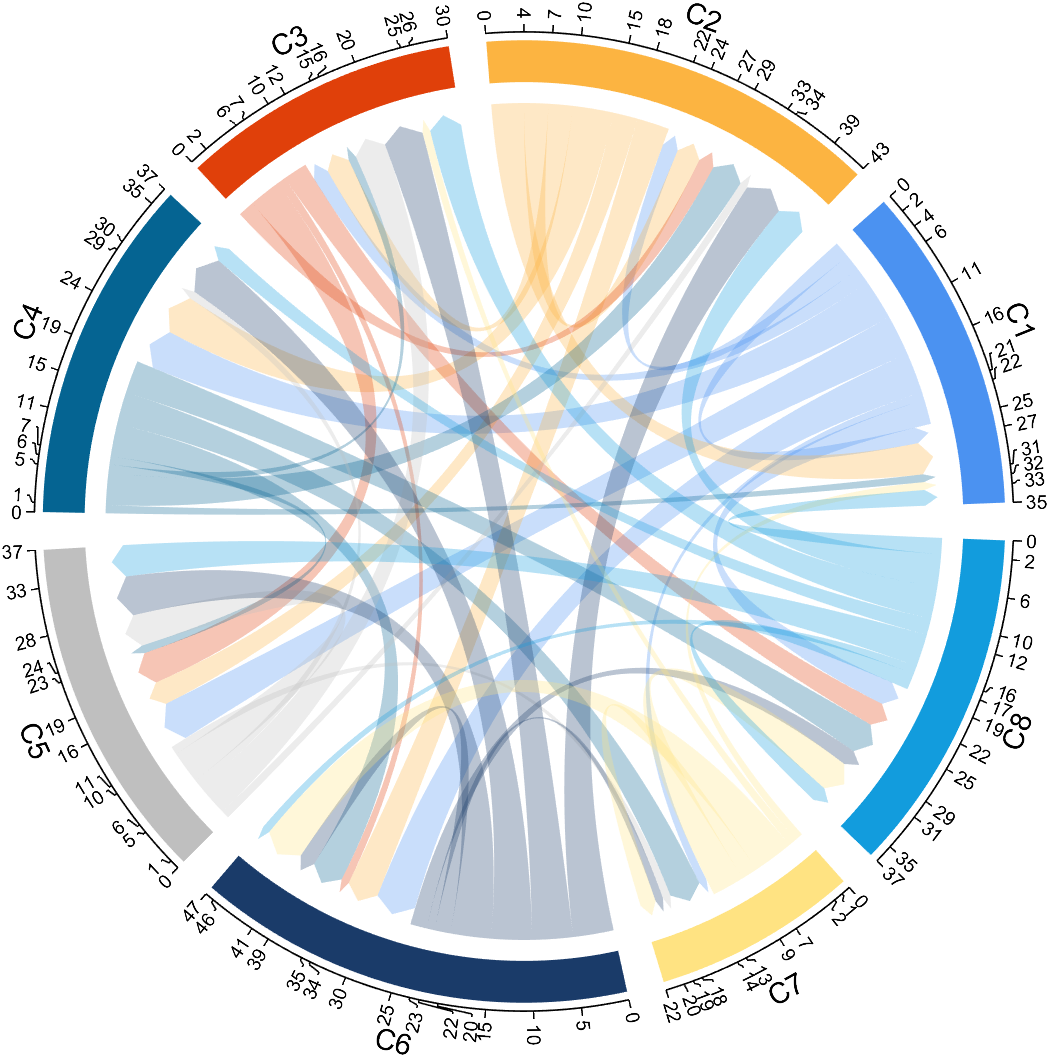
2024-08-09更新
我们在绘制弦图的时候,可能会遇到刻度标签挤在一起看不清的情况:
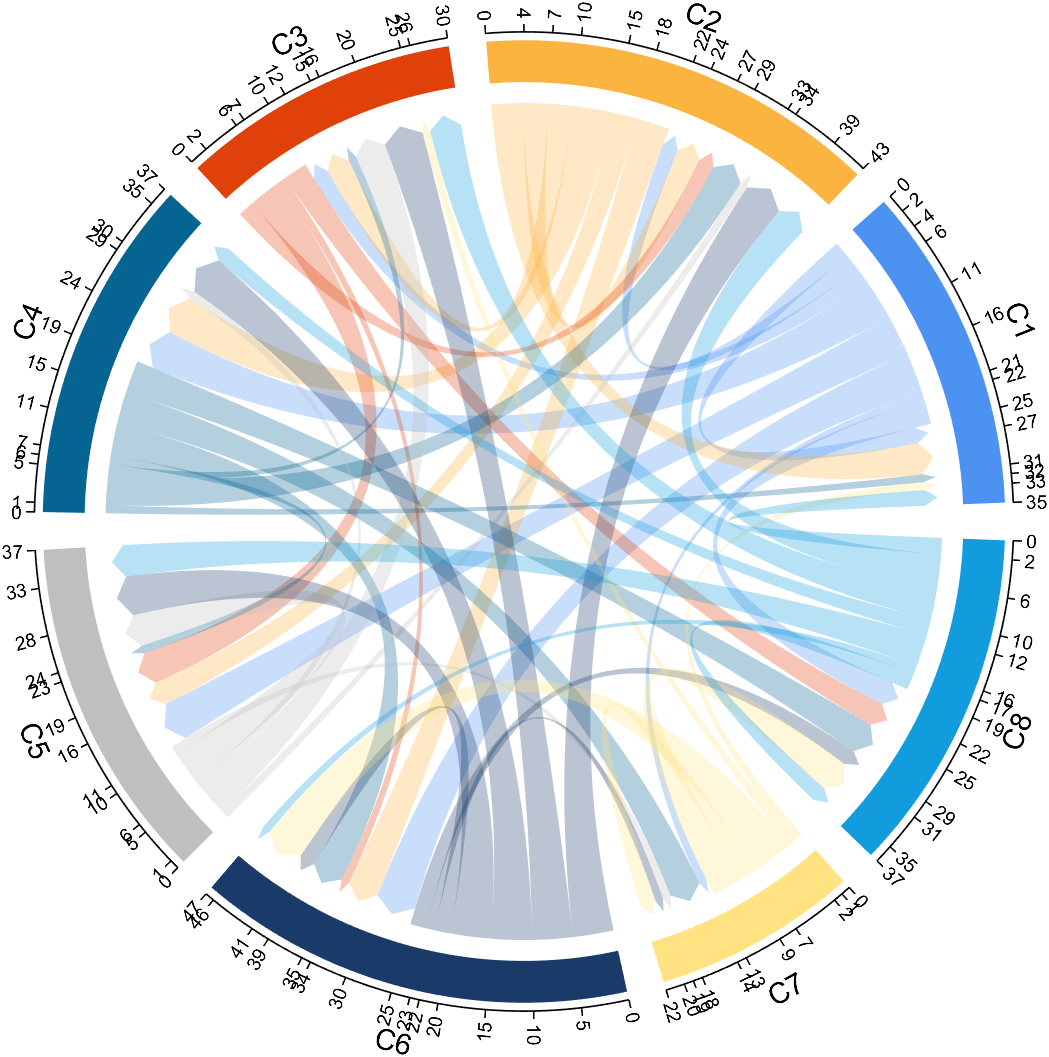
dataMat=randi([0,5],[8,8]);

CList=[75,146,241;252,180,65;224,64,10;5,100,146;191,191,191;
    26,59,105;255,227,130;18,156,221;202,107,75;0,92,219;
    243,210,136;80,99,129;241,185,168;224,131,10;120,147,190]./255;

figure('Units','normalized','Position',[.02,.05,.6,.85])
% TickMode 'value'(default)/'linear'/auto
BCC=biChordChart(dataMat,'Arrow','on','CData',CList);
BCC=BCC.draw();

% 添加刻度
BCC.tickState('on')
BCC.tickLabelState('on')
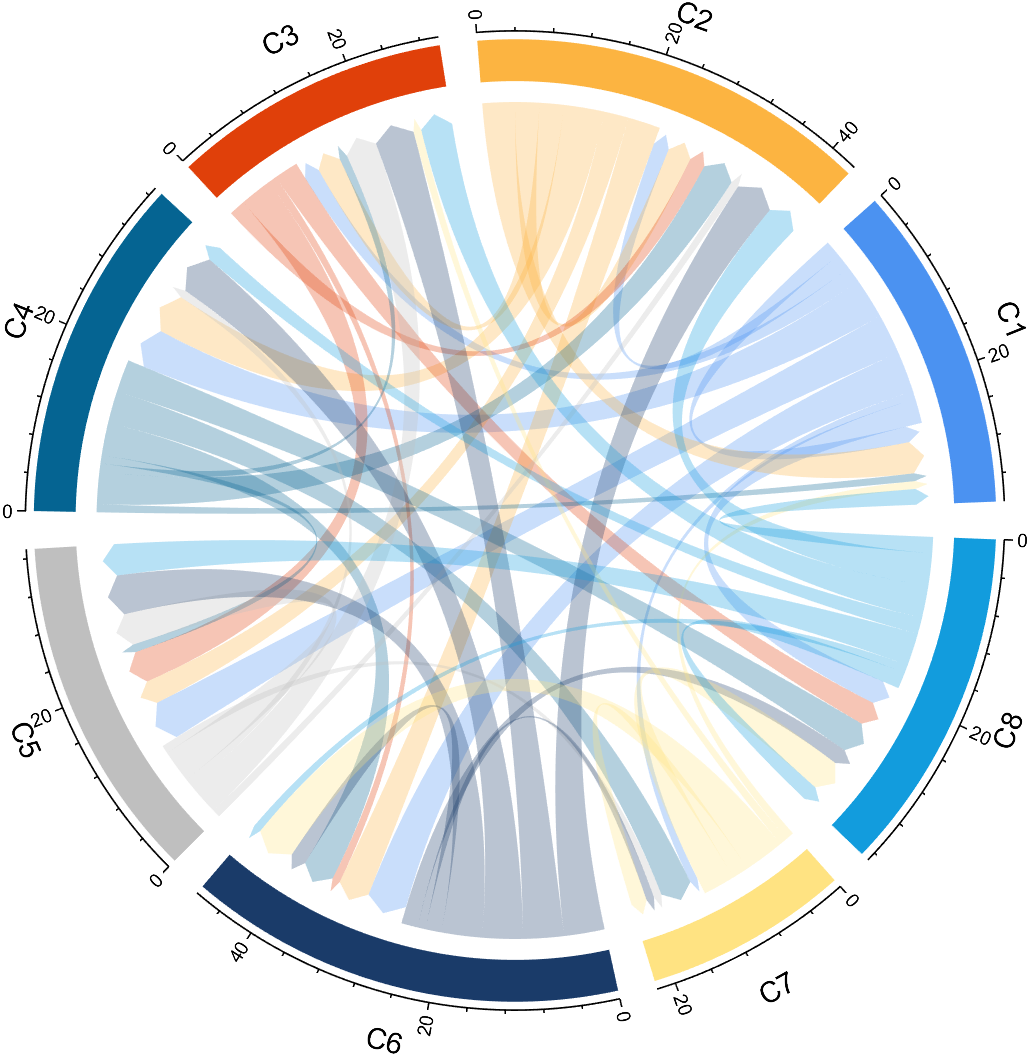
于是我新增了两种刻度标志的方法,分别是 linear 和 auto
linear方法
linear 会在弦图外侧均匀的标上刻度,此外有两个属性是只有设置TickMode属性为 linear 才会生效的:
linearTickCompactDegree刻度的紧密程度,数值越高刻度线数量越多linearMinorTick是否开启次刻度线
dataMat=randi([0,5],[8,8]);

CList=[75,146,241;252,180,65;224,64,10;5,100,146;191,191,191;
    26,59,105;255,227,130;18,156,221;202,107,75;0,92,219;
    243,210,136;80,99,129;241,185,168;224,131,10;120,147,190]./255;

figure('Units','normalized','Position',[.02,.05,.6,.85])
% TickMode 'value'(default)/'linear'/auto
BCC=biChordChart(dataMat,'Arrow','on','CData',CList,'TickMode','Linear');

% 刻度的设置要在draw()之前
% the setting of tick should before draw()
% 刻度的紧密程度,数值越高刻度线数量越多
% The compact degree of ticks, The higher the value, the more scales there are
BCC.linearTickCompactDegree = 2;
% 是否开启次刻度线
% Minor ticks 'on'/'off'
BCC.linearMinorTick = 'on';


BCC=BCC.draw();

% 添加刻度
BCC.tickState('on')
BCC.tickLabelState('on')

auto 方法
这个方法就很简单了,就是如果有两个刻度线离得太近,就会自动的将末端互相远离:
dataMat=randi([0,5],[8,8]);

CList=[75,146,241;252,180,65;224,64,10;5,100,146;191,191,191;
    26,59,105;255,227,130;18,156,221;202,107,75;0,92,219;
    243,210,136;80,99,129;241,185,168;224,131,10;120,147,190]./255;

figure('Units','normalized','Position',[.02,.05,.6,.85])
% TickMode 'value'(default)/'linear'/auto
BCC=biChordChart(dataMat,'Arrow','on','CData',CList,'TickMode','auto');

BCC=BCC.draw();

% 添加刻度
BCC.tickState('on')
BCC.tickLabelState('on')
完
这种圈圈的图的绘制代码写起来真的费脑子,希望大家该点赞的点赞,该在看的在看!!
未经允许本代码请勿作商业用途,引用的话可以引用我file exchange上的链接,可使用如下格式:
Zhaoxu Liu / slandarer (2022). Digraph chord chart 有向弦图 (https://www.mathworks.com/matlabcentral/fileexchange/121043-digraph-chord-chart), MATLAB Central File Exchange. 检索来源 2022/11/22.
若转载请保留以上file exchange链接及本文链接!!!!!

有“AI”的1024 = 2048,欢迎大家加入2048 AI社区
更多推荐
 53
53 0
0- 0


 已为社区贡献48条内容

所有评论(0)