基于uniapp小程序的Echarts最佳解决方案!
点击上方前端Q,关注公众号回复加群,加入前端Q技术交流群对于在小程序中写Echarts,其实不少人存在「矛盾点」。最经典的比如,你又想用Uniapp开发小程序,又想在原生里看效果,可各种Echarts库,「试来试去,时常报错+视图消失,找来找去,各种包疯狂安装,还是用不起来,所以就让人很苦闷。」因此从一开始,在写小程序的时候,就要后续会出现的问题,通通考虑清楚,在极大程度上会「减轻你的开发负荷」.
点击上方 前端Q,关注公众号
回复加群,加入前端Q技术交流群
对于在小程序中写Echarts,其实不少人存在「矛盾点」。最经典的比如,你又想用Uniapp开发小程序,又想在原生里看效果,可各种Echarts库,「试来试去,时常报错+视图消失,找来找去,各种包疯狂安装,还是用不起来,所以就让人很苦闷。」
因此从一开始,在写小程序的时候,就要后续会出现的问题,通通考虑清楚,在极大程度上会「减轻你的开发负荷」。
因此,这一次,咱们聊聊——「《基于uniapp小程序的Echarts使用问题》」,vue2 or vue3到底如何选型?如何安装并顺利使用?后续一系列会出现的bug,也会统统罗列,并给出解决方案。
「拜托拜托」:大家的点赞是我更新的最大动力!!!

一.对于Vue2+uniapp+Echarts库的选择方案
写这篇攻略的目的很简单,那就是网上关于小程序Echarts部分,信息过于细碎,每个人的解决方案都不同,给一部分绕晕,耽误两天时间......所以这次一把给你讲个够!
首先需要讲的是,vue2+uniapp开发小程序的话,你的首选可以定为「echarts-for-wx」,前几年Echarts专门为了适配小程序,而开发出的「工具包」。
「尽管更新日期维持在2020年,但放在今天,同样可以便捷使用在实际项目中,表现同样炸裂!」
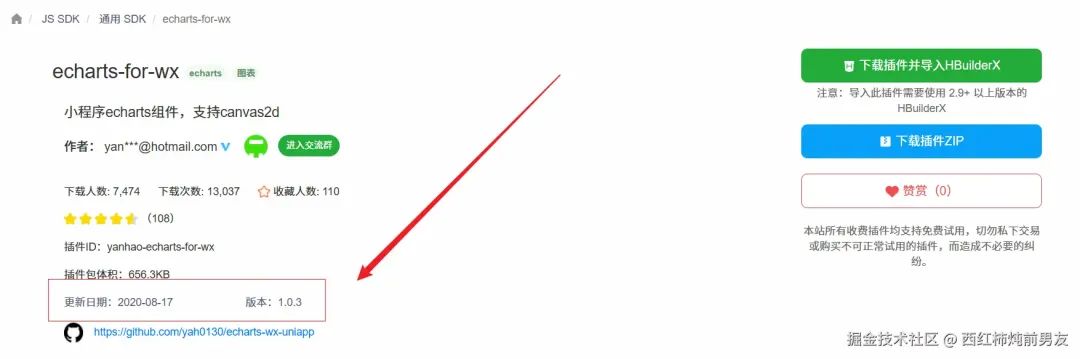
对于Echarts-for-wx的安装,我的建议是,直接「下载ZIP源码」,然后挪到自己的项目里,再配置各种引用地址这种,是最稳妥的。(所以你也别再走弯路了,看完你就拿下它了)
「源码地址放在这里,大家直接用即可」:https://github.com/yah0130/echarts-wx-uniapp
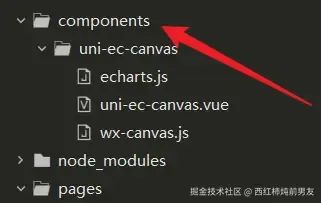
把里面这个uni-ec-canvas文件夹下载下来,放在你的项目中

但是这里要注意一点,先建一个components文件夹,再把uni-ec-canvas放进去,具体情况你可以看下图:
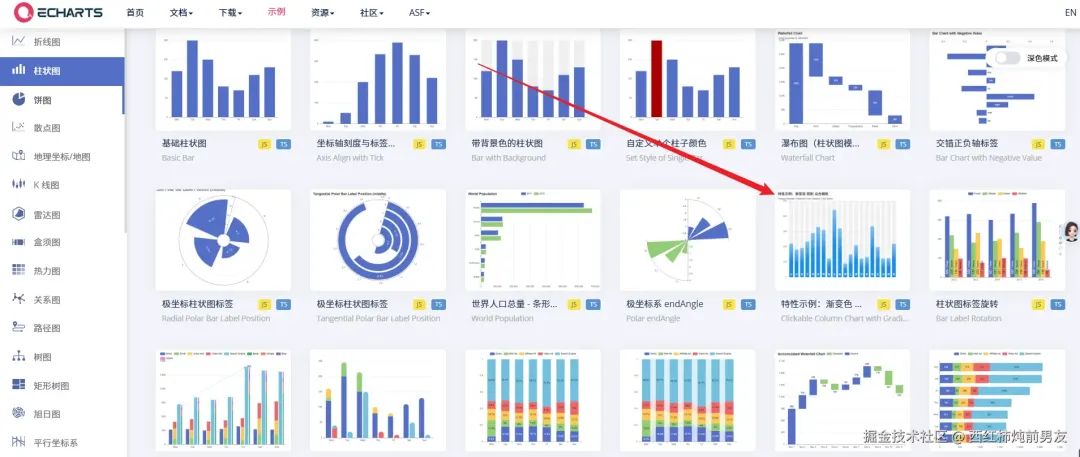
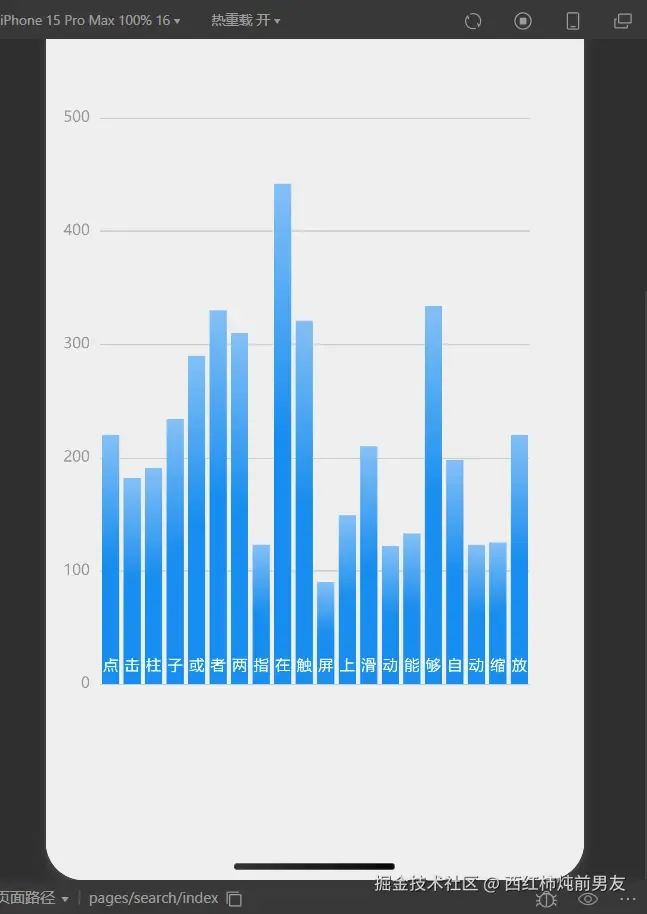
然后咱们去Echarts官网,我挑一个图表,用来演示一下:(挑一个好看的)
第一步,先写template:
<view>
        <uni-ec-canvas class="uni-ec-canvas" id="line-chart" canvas-id="multi-charts-line" :ec="ec" ref="canvas"></uni-ec-canvas>
      </view>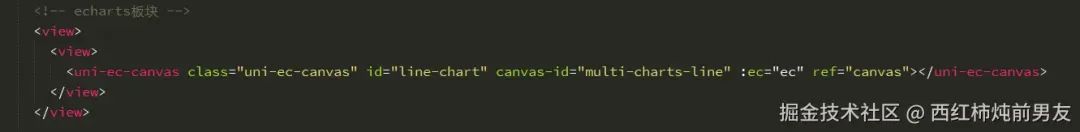
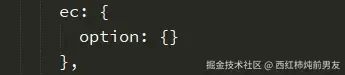
然后把数据项ec定义一下:(放在data里)
ec: {
        option: {}
      },
接着你要在script标签里,导入如下两个依赖:
import uniEcCanvas from '@/components/uni-ec-canvas/uni-ec-canvas';
import * as echarts from '@/components/uni-ec-canvas/echarts.js';
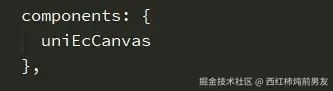
导入之后要注册组件:
components: {
    uniEcCanvas
  },
然后咱们把数据option,从Echarts官网,给粘贴过来,当然你也可以在Echarts官网修改成自己想要的样子,然后再移植,同理。
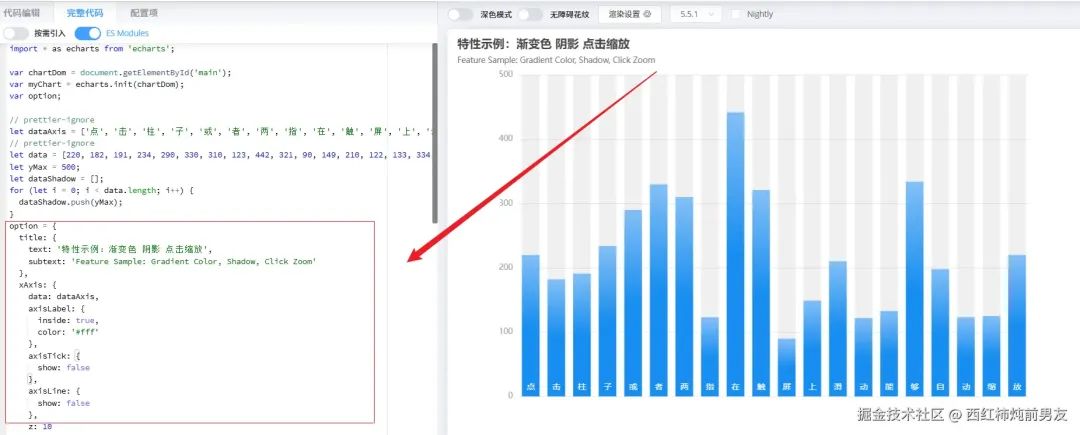
这里需要讲的是,小程序的写法,会有一点“「花招」”,从获取容器,再到挂载数据等等,你都可以在方法中定义好,然后在“钩子函数”里进行相应的“初始化操作”。(所以这里我的option,没有写在data里)
「代码奉上」:
initChart(canvas, width, height, canvasDpr) {
      let chart = echarts.init(canvas, null, {
        width: width,
        height: height,
        devicePixelRatio: canvasDpr
      });
      canvas.setChart(chart);
      let option = {
        xAxis: {
          data: ['点', '击', '柱', '子', '或', '者', '两', '指', '在', '触', '屏', '上', '滑', '动', '能', '够', '自', '动', '缩', '放'],
          axisLabel: {
            inside: true,
            color: '#fff'
          },
          axisTick: {
            show: false
          },
          axisLine: {
            show: false
          },
          z: 10
        },
        yAxis: {
          axisLine: {
            show: false
          },
          axisTick: {
            show: false
          },
          axisLabel: {
            color: '#999'
          }
        },
        dataZoom: [
          {
            type: 'inside'
          }
        ],
        series: [
          {
            type: 'bar',
            itemStyle: {
              color: new echarts.graphic.LinearGradient(0, 0, 0, 1, [
                { offset: 0, color: '#83bff6' },
                { offset: 0.5, color: '#188df0' },
                { offset: 1, color: '#188df0' }
              ])
            },
            emphasis: {
              itemStyle: {
                color: new echarts.graphic.LinearGradient(0, 0, 0, 1, [
                  { offset: 0, color: '#2378f7' },
                  { offset: 0.7, color: '#2378f7' },
                  { offset: 1, color: '#83bff6' }
                ])
              }
            },
            data: [220, 182, 191, 234, 290, 330, 310, 123, 442, 321, 90, 149, 210, 122, 133, 334, 198, 123, 125, 220]
          }
        ]
      };
      chart.setOption(option);
      console.log('chart', chart.getOption());
      const dataAxis = chart.getOption().xAxis[0].data;
      const zoomSize = 6;
      let data = [220, 182, 191, 234, 290, 330, 310, 123, 442, 321, 90, 149, 210, 122, 133, 334, 198, 123, 125, 220];
      chart.on('click', function (params) {
        // console.log(this.dataAxis[Math.max(params.dataIndex - zoomSize / 2, 0)]);
        chart.dispatchAction({
          type: 'dataZoom',
          startValue: dataAxis[Math.max(params.dataIndex - zoomSize / 2, 0)],
          endValue: dataAxis[Math.min(params.dataIndex + zoomSize / 2, data.length - 1)]
        });
      });
      return chart;
你在用的时候,可以直接用我这一套,写在methods里,从上到下,依次做了以下几步操作:
「1」. 初始化实例,并且绑定到canvas上
「2」. 定义option数据(注意不要写成options!!!)
「3」. 通过setOption进行挂载
「4」. 对具体图表,进行定制化操作
当然你要注意一点的是,在小程序中,如何往Echarts绑定事件?比如经典的click、mouse等等,其实和PC还是很类似的。
上述代码中,chart.on就是很好的例子,你可以看一看,一眼就懂。
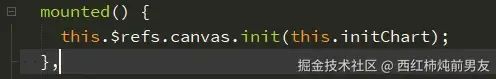
「咱们定义完initChart之后,接下来要做的当然是使用它:(在钩子里进行调用)」
mounted() {
    this.$refs.canvas.init(this.initChart);
  },
上述内容做完之后,咱们预览一下:
当然这里要注意,很多人会在原生里碰到诸多bug,因此这里给一些解决方案。

比如如果你碰到这个问题,那么第一时间,要去看canvas,看你挂载的option,是否存在,是否正常。
举个例子,如果你的data中的ec没写option,那么也会出现这种问题。(后面我会把我所有代码奉上,只要参考对了,就会规避这个bug)

还有的问题比较常见,比如以下这个问题:

这个你就要去找“容器”的问题,如何获取的?ref还是id还是......,打印输出一下,看看有没有获取到。
另外就是在Hbuild里面,打开谷歌浏览器,看不到内容,可是在真机里,又能看到内容,怎么办?(对方已经很清晰告诉你了,改正即可)

最后代码一五一十,全部奉上,上手Echarts就不是什么难题了!(因为我这里有一些业务代码,已经自行删除了部分,所以这个版本,你可以直接用,但会有一些没用的变量,你自己删除就好,提前告知一下)
<template>
  <view class="container">
    <!-- echarts板块 -->
    <view>
      <view>
        <uni-ec-canvas class="uni-ec-canvas" id="line-chart" canvas-id="multi-charts-line" :ec="ec" ref="canvas"></uni-ec-canvas>
      </view>
    </view>
</template>

<script>
import uniEcCanvas from '@/components/uni-ec-canvas/uni-ec-canvas';
import * as echarts from '@/components/uni-ec-canvas/echarts.js';
export default {
  data() {
    return {
      data: [220, 182, 191, 234, 290, 330, 310, 123, 442, 321, 90, 149, 210, 122, 133, 334, 198, 123, 125, 220],
      yMax: 500,
      zoomSize: 6,
      dataShadow: [],
      ec: {
       option:{}
      },
      dataAxis: ['点', '击', '柱', '子', '或', '者', '两', '指', '在', '触', '屏', '上', '滑', '动', '能', '够', '自', '动', '缩', '放']
    };
  },

  mounted() {
    this.$refs.canvas.init(this.initChart);
  },


  components: {
    uniEcCanvas
  },

  methods: {
    initChart(canvas, width, height, canvasDpr) {
      let chart = echarts.init(canvas, null, {
        width: width,
        height: height,
        devicePixelRatio: canvasDpr
      });
      canvas.setChart(chart);
      let option = {
        xAxis: {
          data: ['点', '击', '柱', '子', '或', '者', '两', '指', '在', '触', '屏', '上', '滑', '动', '能', '够', '自', '动', '缩', '放'],
          axisLabel: {
            inside: true,
            color: '#fff'
          },
          axisTick: {
            show: false
          },
          axisLine: {
            show: false
          },
          z: 10
        },
        yAxis: {
          axisLine: {
            show: false
          },
          axisTick: {
            show: false
          },
          axisLabel: {
            color: '#999'
          }
        },
        dataZoom: [
          {
            type: 'inside'
          }
        ],
        series: [
          {
            type: 'bar',
            itemStyle: {
              color: new echarts.graphic.LinearGradient(0, 0, 0, 1, [
                { offset: 0, color: '#83bff6' },
                { offset: 0.5, color: '#188df0' },
                { offset: 1, color: '#188df0' }
              ])
            },
            emphasis: {
              itemStyle: {
                color: new echarts.graphic.LinearGradient(0, 0, 0, 1, [
                  { offset: 0, color: '#2378f7' },
                  { offset: 0.7, color: '#2378f7' },
                  { offset: 1, color: '#83bff6' }
                ])
              }
            },
            data: [220, 182, 191, 234, 290, 330, 310, 123, 442, 321, 90, 149, 210, 122, 133, 334, 198, 123, 125, 220]
          }
        ]
      };
      chart.setOption(option);
      console.log('chart', chart.getOption());
      const dataAxis = chart.getOption().xAxis[0].data;
      const zoomSize = 6;
      let data = [220, 182, 191, 234, 290, 330, 310, 123, 442, 321, 90, 149, 210, 122, 133, 334, 198, 123, 125, 220];
      chart.on('click', function (params) {
        // console.log(this.dataAxis[Math.max(params.dataIndex - zoomSize / 2, 0)]);
        chart.dispatchAction({
          type: 'dataZoom',
          startValue: dataAxis[Math.max(params.dataIndex - zoomSize / 2, 0)],
          endValue: dataAxis[Math.min(params.dataIndex + zoomSize / 2, data.length - 1)]
        });
      });
      return chart;
    },

};
</script>

<style scoped>
.container {
  background-color: rgb(238, 238, 239);
  display: flex;
  flex-direction: column;
  /* justify-content: center; */
  align-items: center;
  height: 100vh; /* 设置容器高度为视口高度,使其占满整个屏幕 */
}

</style>
二.对于Vue3+uniapp+Echarts库的选择方案
vue3生态相对来讲,加入echarts就很简单了,咱们直接用这一款。有的人叫它“「lime-echart」",其实就是咱们PC的echarts。


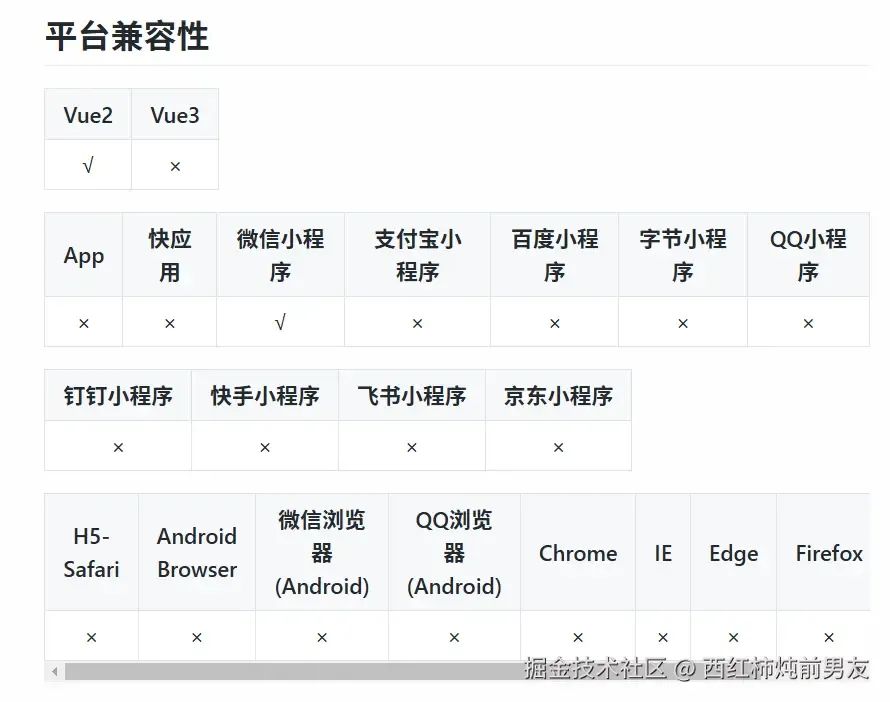
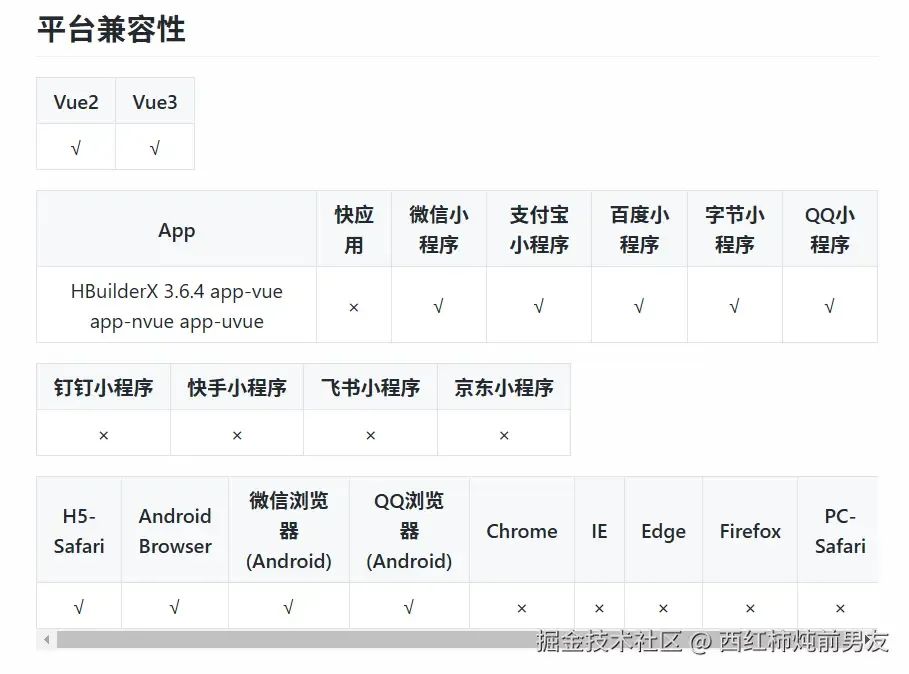
目前各端兼容性还不错,也在一直更新
安装的时候,咱们还是下载源码,然后往项目中引入
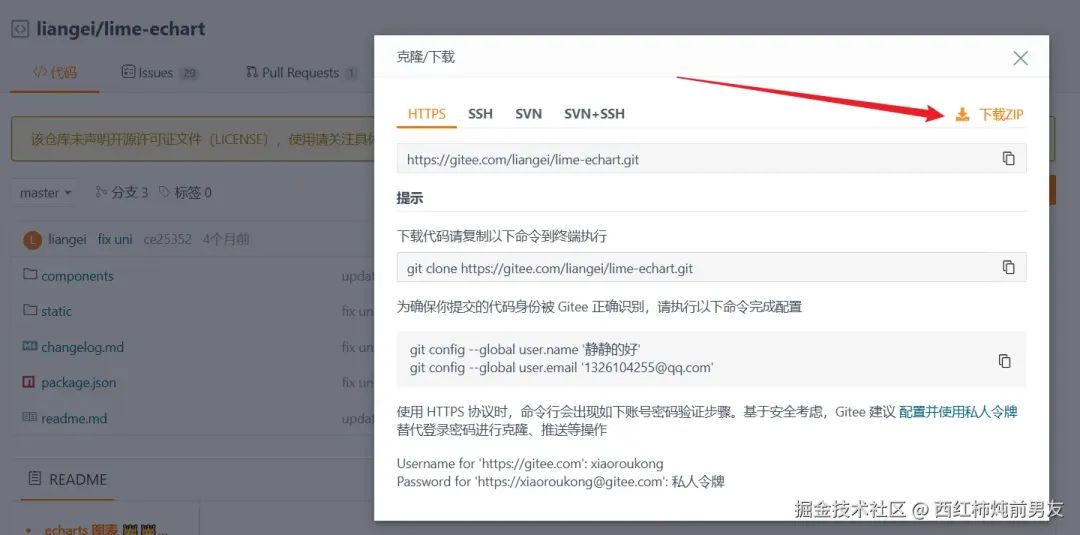
vue3 echarts地址:https://gitee.com/liangei/lime-echart
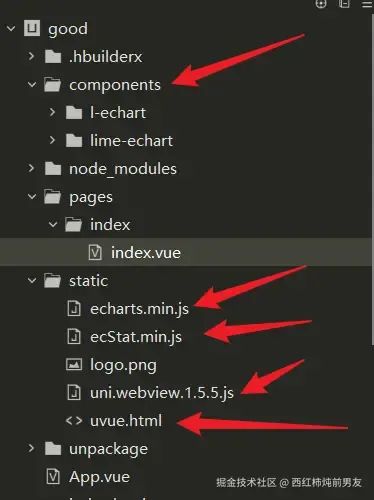
整体下载完之后,咱们把components文件夹,直接放在项目中。
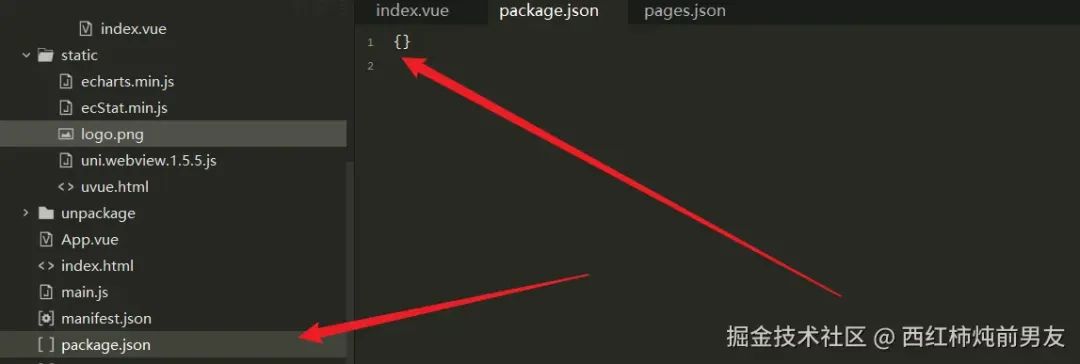
然后把static文件夹的内容,全部放在项目的static文件中,我把项目图放一下,大家一看便知:
接下来,把我这段代码放上,里面其实无非还是引入依赖,然后把例子放上,你可以感受一下,直接出图:
<template>
  <view>
    <view class="title">我的主页</view>
    <view>
      <LEchart class="echart" ref="chart" @finished="init"></LEchart>
    </view>
  </view>
</template>

<script setup>
import LEchart from '@/components/l-echart/l-echart.vue';
// lime-echart是一个demo的组件,用于测试组件
// import LEchart from '@/components/lime-echart/lime-echart.vue'
import { onMounted, reactive, ref } from 'vue';

// 由于vue3 使用vite 不支持umd格式的包,小程序依然可以使用,但需要使用require
const echarts = require('../../static/echarts.min');

let chart = ref(); // 获取dom
const state = reactive({
  option: {}
});
state.option = {
  legend: {
    show: true,
    data: []
  },
  tooltip: {
    trigger: 'axis',
    axisPointer: {
      type: 'cross'
    }
  },
  grid: {
    left: '3%',
    right: '8%',
    top: '15%',
    bottom: '5%',
    containLabel: true
  },
  xAxis: {
    type: 'category',
    data: [1, 2, 3, 4, 5, 6, 7, 8, 9, 10, 11, 12, 13, 1, 4, 15, 16, 17, 18, 19, 20, 21, 22, 23, 24],
    axisLabel: {
      // inside: true,
      // color: '#fff'
    },
    axisTick: {
      show: false
    },
    axisLine: {
      show: true,
      lineStyle: {
        color: '#83bff6'
      }
    },
    z: 10
  },
  yAxis: {
    type: 'value',
    axisLine: {
      show: true,
      lineStyle: {
        color: '#83bff6'
      }
    },
    axisTick: {
      show: false
    },
    // axisLabel: {
    //   color: '#999'
    // },
    splitLine: {
      show: true,
      lineStyle: {
        type: 'dashed',
        color: '#83bff6'
      }
    }
  },
  series: [
    {
      data: [100, 110, 113, 126, 143, 158, 165, 167, 152, 102, ,],
      type: 'bar',
      itemStyle: {
        color: new echarts.graphic.LinearGradient(0, 0, 0, 1, [
          { offset: 0, color: '#83bff6' },
          { offset: 0.5, color: '#188df0' },
          { offset: 1, color: '#188df0' }
        ])
      },
      emphasis: {
        itemStyle: {
          color: new echarts.graphic.LinearGradient(0, 0, 0, 1, [
            { offset: 0, color: '#2378f7' },
            { offset: 0.7, color: '#2378f7' },
            { offset: 1, color: '#83bff6' }
          ])
        }
      },
      areaStyle: {
        show: true,
        color: new echarts.graphic.LinearGradient(0, 0, 0, 1, [
          {
            offset: 0,
            color: '#188df0'
          },
          {
            offset: 1,
            color: '#fff'
          }
        ])
      }
    }
  ],
  color: ['#83bff6']
};
// 组件能被调用必须是组件的节点已经被渲染到页面上
onMounted(() => {
  chart.value.init(echarts, (chart) => {
    chart.setOption(state.option);
  });
});

// 渲染完成
const init = () => {
  console.log('渲染完成');
};
</script>

<style scopedlang="scss" scoped>
.echart {
  width: 100%;
  height: 300px;
}

.title {
  text-align: center;
}
</style>
需要注意的是,目前部分人给出的安装方案,一是要挪安装包,一个是npm下载,事实证明,选其一即可,我选的是前者,也很稳妥,照做即可。
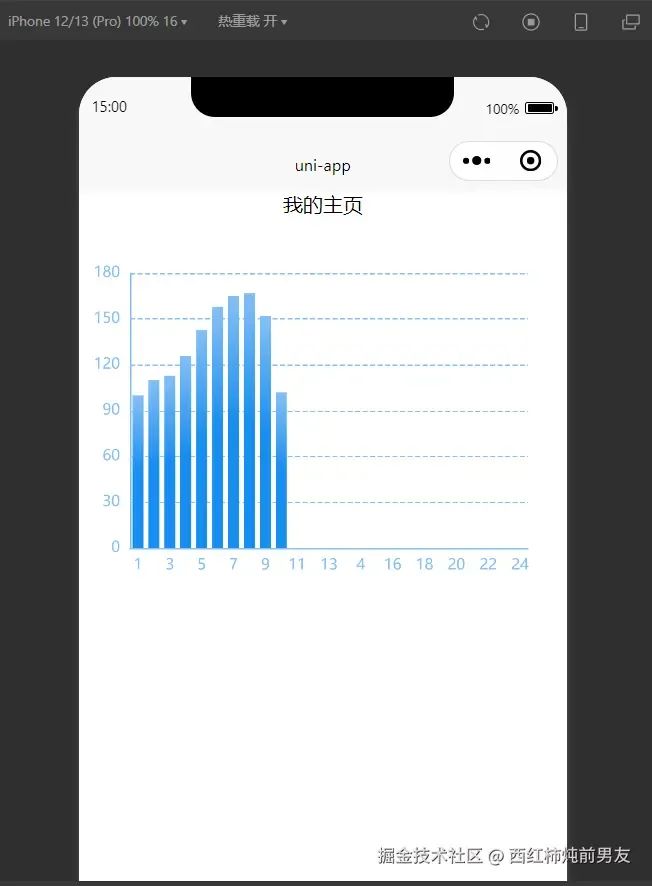
最后放上效果图:
完结撒花!

往期推荐
Flutter 被分叉!团队缩水至 50 人,bug 堆积如山,前谷歌员工出手找出路

不容错过!前端速通Blob、File、FileReader、ArrayBuffer、Base64...


最后
-
欢迎加我微信,拉你进技术群,长期交流学习...
-
欢迎关注「前端Q」,认真学前端,做个专业的技术人...


点个在看支持我吧

有“AI”的1024 = 2048,欢迎大家加入2048 AI社区
更多推荐


 2
2 0
0- 0


 已为社区贡献14条内容

所有评论(0)