matlab 实现散点曲线拟合+拟合函数的获取+绘制曲线的上下顶点的切线
n =5;%polyfit 返回值p从左到右是高次到低次的多项式p(x)的系数,长度是n+1%p(x) = p1 * x(n次方) + p2 * x(n-1次方)+ 。。。 + pn * x + pn+1p = polyfit(x,y,n);f1 = polyval(p,x);% plot(x,f1,'r-');%获得多项式的方程syms mfor k=1:n+1var(k) = m ^(k -1
·
一 多项式拟合,数据分布相对光滑的情况,更想要的是数据的整体分布趋势,对于单个数据点的准确度要求不高
n =5;
%polyfit 返回值p从左到右是高次到低次的多项式p(x)的系数,长度是n+1
%p(x) = p1 * x(n次方) + p2 * x(n-1次方)+ 。。。 + pn * x + pn+1
p = polyfit(x,y,n);
f1 = polyval(p,x);
% plot(x,f1,'r-');

%获得多项式的方程
syms m
for k  =1:n+1
    var(k) = m ^(k -1);
end
func = flip(var) .* p;
f = sum(func);
m = min(x):max(x);
scatter(x,y,'o');hold on;
handles1 = plot(m,subs(f));hold on;

%找曲线的最大最小值,即曲线的上下顶点
result = subs(f);
max_f = max(result(:));
min_f = min(result(:));
line( [min(x),max(x)],[max_f,max_f],'linestyle','--');hold on;  %画顶点线
line( [min(x),max(x)],[min_f,min_f],'linestyle','-');hold on;  %画顶点线
pause(2);

%cla reset;这个语句可以实现figure图像的清空
%vap(x)将分数转换为小数

推荐网址,比较全面 https://blog.csdn.net/zengxiantao1994/article/details/77943305

n =3;
x = new_HU_data;
y_w = new_WATER_data;
%polyfit 返回值p从左到右是高次到低次的多项式p(x)的系数,长度是n+1
%p(x) = p1 * x(n次方) + p2 * x(n-1次方)+ 。。。 + pn * x + pn+1
p = polyfit(x,y_w,n);
Funtion_w = polyval(p,x);   %%%%% funtion, input x, don't change p, get new Y
二 每个数据点都不能丢失,要想连接所有的数据点
    x = [1.0000    1.5000    2.0000    3.0000    4.0000    5.0000    6.0000    8.0000   10.0000   15.0000   20.0000 30.0000   40.0000   50.0000   60.0000   80.0000  100.0000  150.0000];
    y = [1.5700    0.5355    0.3092    3.1920    2.7770    0.9784    0.4529    0.2450    0.1470    0.0647    0.0339 0.0103    0.0045    0.0014    0.0007    0.0004    0.0003    0.0002];
    xx = x(1):1:x(end);
    yy = spline(x,y,xx);
    plot(x,y,'o',xx,yy);

3 . 绘制没有数据的网格
figure(1);
axis([0 500 1 500])
grid

三 x出现重复数据,也就是一个x对应两个y的时候,要拟合数据获取数据点,可以从重复的地方分成前后两段
filename = xlsread("GOS_μ_μen.xlsx");
energy = filename(:,1)*1000;
M_GOS_nist = filename(:,3);
Men_GOS_nist = filename(:,5);

%GOS
fp6 = fopen('GOSMassAttn.dat','rb');
DensityGOS = fread(fp6,1,'float32');
EnergyNum6 = fread(fp6,1,'int');
Energy6 = fread(fp6,EnergyNum6,'float32');
M_Gos = fread(fp6,EnergyNum6,'float32');
fclose(fp6);


x = energy(32:43);  %from 10kev to 150kev
y = M_GOS_nist(32:43);
[fitresult,~] = createFit(x(1:7),y(1:7));
xx1 = 10:50;  yy1 = fitresult(xx1);
[fitresult,~] = createFit(x(8:end),y(8:end));
xx2 = 50:150;  yy2 = fitresult(xx2);

figure(2);hold on;
plot(xx1,yy1','o');
plot(xx2,yy2','*');
plot(10:150,M_Gos(10:150),'k-.');
三 已知两个点的坐标,绘制连线,并添加坐标标签
set(0,'defaultfigurecolor','w')
figure(1); hold on;
%%%%%%%%%%%%%%%%%%%%%%%%%%%%%%% % S1 D1%%%%%%%%%%%%%%%% %%%%%%%%%%%%%%%%
plot([r_A(1), r_B(1)], [r_A(2), r_B(2)], 'b-.o','LineWidth',2); % '-o' 表示画线并标记点
text(r_A(1)+250, r_A(2)+100, sprintf('r_A = (%g, %g)', r_A(1), r_A(2)), ...
    'VerticalAlignment', 'bottom', 'HorizontalAlignment', 'right', 'FontSize', 12, 'Color', 'blue');
text(r_B(1)+250, r_B(2)-100, sprintf('r_B = (%g, %g)', r_B(1), r_B(2)), ...
    'VerticalAlignment', 'bottom', 'HorizontalAlignment', 'right', 'FontSize', 12, 'Color', 'blue');
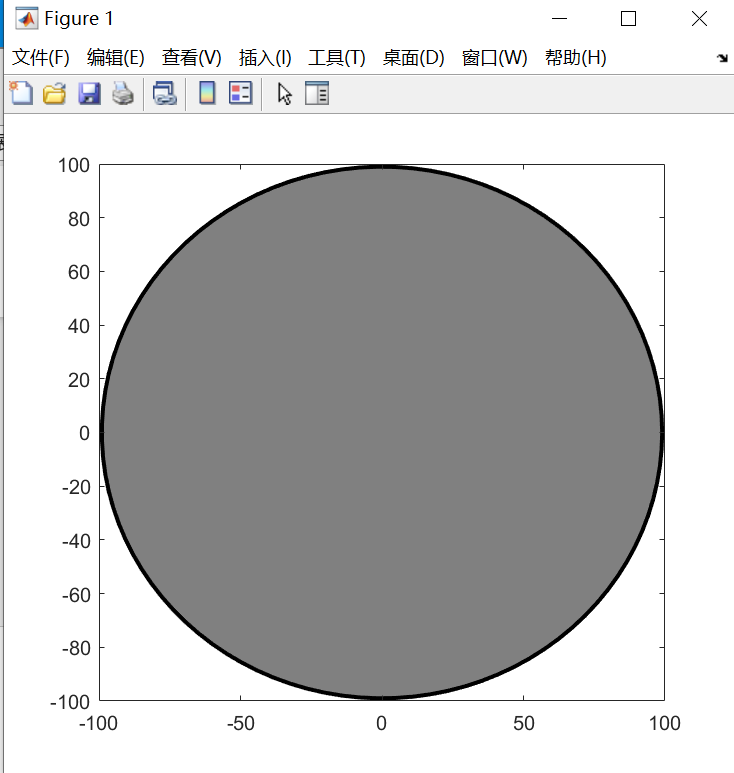
四 绘制圆并填充
theta = linspace(0, 2*pi, 100);
x_sample = FOV_R * cos(theta);
y_sample = FOV_R * sin(theta);
fill(x_sample, y_sample, [0.5 0.5 0.5], 'EdgeColor', 'k', 'LineWidth', 2); % [0.5 0.5 0.5] 表示灰色

有“AI”的1024 = 2048,欢迎大家加入2048 AI社区
更多推荐

 5
5 0
0- 0


 已为社区贡献4条内容

所有评论(0)